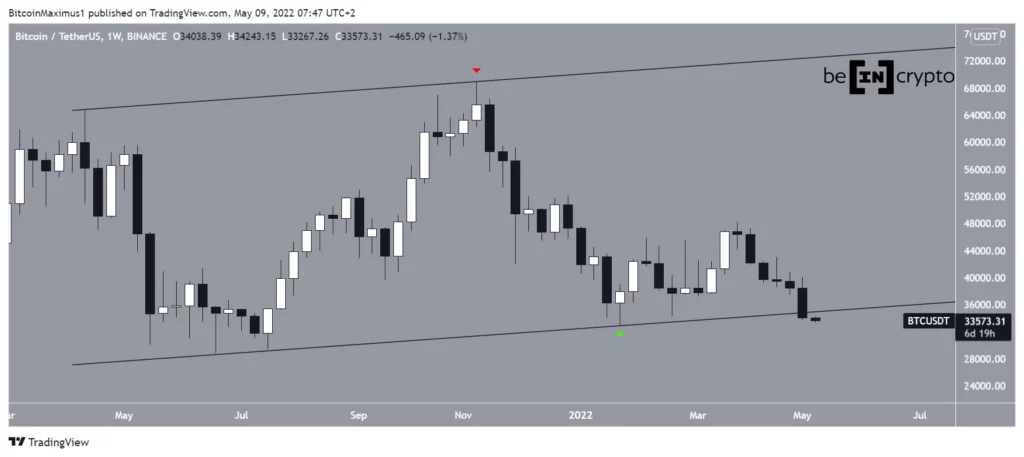
Bitcoin (BTC) has been falling at an accelerated rate since May 4 and is in the process of breaking down from a long-term structure.
Bitcoin has been falling since hitting an all-time high of $69,000 on November 10, 2021 (red icon). The downward move was briefly halted after hitting a local of $32,917 on January 23, 2022. The subsequent bounce served to validate the line of a potential ascending parallel channel.
This led to a local high of $48,189 at the end of March, but the price has been falling since. So far, it has reached a low of $33,267, which is very close to the yearly low of $32,917.
BTC is currently in the process of breaking away from the ascending parallel channel in place since May 2021. A breakout of such a long structure could lead to the acceleration of the downward movement.
Additionally, it’s worth noting that BTC has generated six successive bearish candlesticks, which is the most since 2014. There have never been seven successive bearish candlesticks.
Bearish Readings
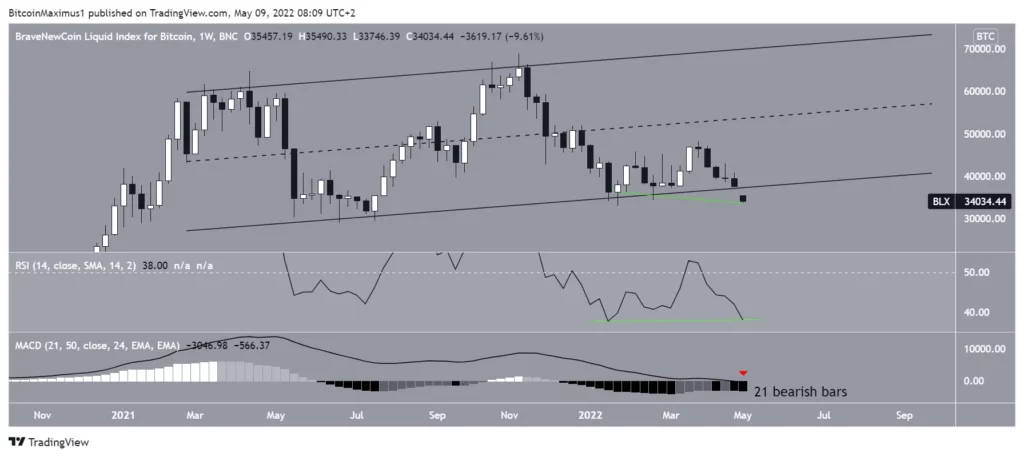
Technical indicators on the weekly timeframe are bearish. The weekly RSI and the MACD are down, and the latter has just moved into negative territory (red icon). The MACD also generated 21 consecutive bearish bars.
While there is a potential bullish divergence developing in the RSI (green line), it’s quite small and has yet to be confirmed.
Fractals
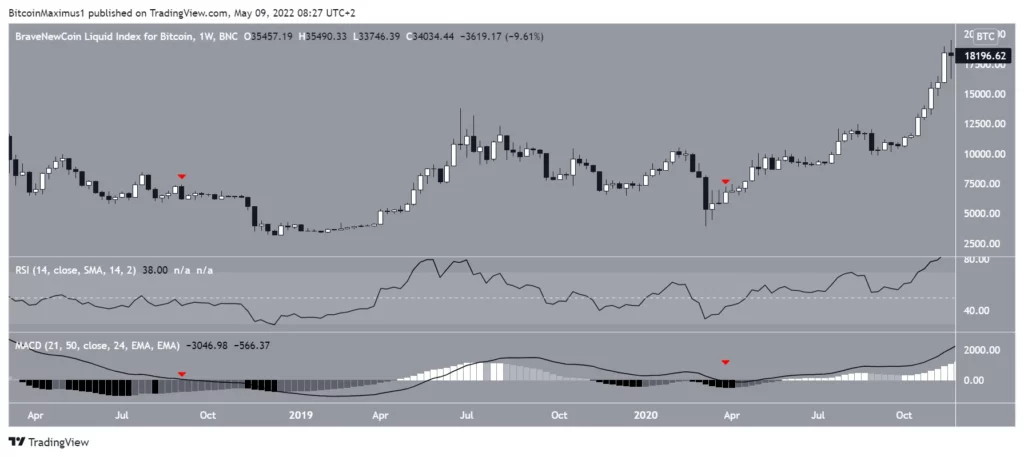
The indicator readings share some similarities with the movement in 2018 and March 2020 (red icons). The similarities stem from the MACD crossover in negative territory and at least 21 successive bearish momentum bars.
Due to the lower RSI reading, the current attributes are slightly closer to those in 2020 than those in 2018.
While both moves were pretty close to lows, BTC had yet to bottom in 2018 but had already done so in 2020.
Future BTC movement
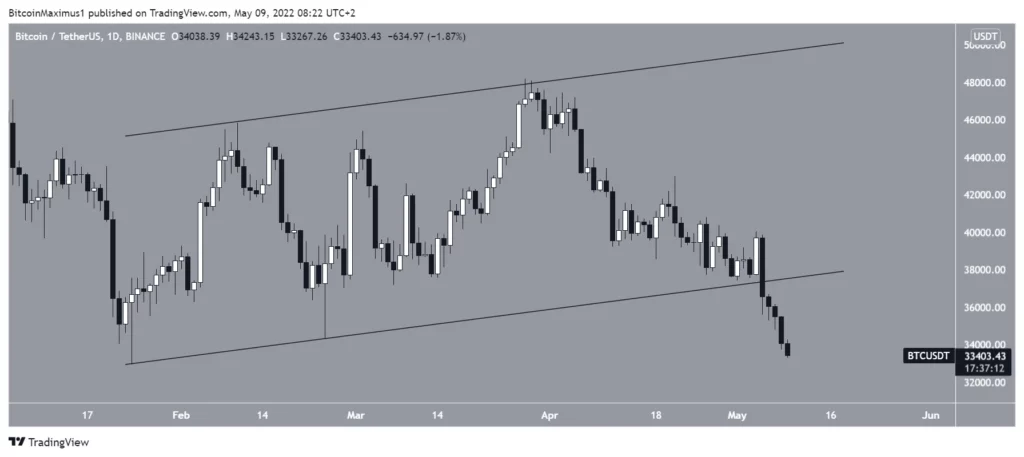
Finally, the daily time frame shows that BTC has broken down from a short-term ascending parallel channel that had previously been in place since Jan. 24.
Other than the possibility of a double bottom pattern near $32,000, there is no bullish sign in place.