
Shiba Inu shows one of the first bullish signals in weeks, here’s what it is
One of the most popular cryptocurrencies in 2021 and one of the most mentioned memecurrencies in the world, Shiba Inu has finally shown positive movements in the market, after more than two weeks of negative market performance.
The first bullish signal provided by technical indicators is the MACD cross on the daily chart of SHIB tokens, which is one of the first indicators of a reversal on any type of asset. We also saw a confirmation of the reversal on the MACD histogram, which is used to determine the strength of a trend.
The histogram on Shiba Inu only turned green a day ago, suggesting the diminishing selling pressure we saw earlier. But despite the presence of both indicators, we should not yet consider Shiba Inu as the most potential asset in the market, as SHIB has not yet shown any signs of bullish activity.
Long-term indicators like the exponential moving average have shown no noticeable changes in the last few weeks. The 200-day moving average still prevails over the 50-day moving average, which is a major sign for an asset that remains in the downtrend.
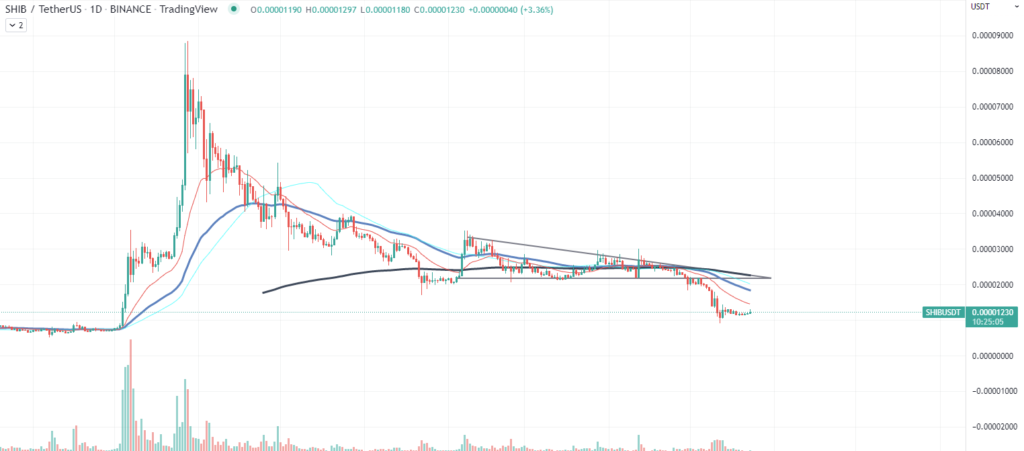
Unfortunately, Shiba Inu’s run to the bottom was accelerated after the token fell below the descending triangle formation, which acted as a ramp for the token which had been in a downtrend for 200 days.
After a brief drop below $0.00001, the market saw a spike in sell orders on Shiba Inu as traders lost all their hope for the reversal after the token lost over 86% of its value from the all-time high. At press time, Shiba trades at $0.000012.