
Ethereum was in a steady downtrend and has been since April. The selling pressure has been so intense that even long-term investors who hadn’t sold ETH in a year had been forced to sell. What was the most likely path forward for ETH on the price charts?
Since May 12, the USDT dominance metric has been declining. It fell from 6.75% that day to 6.05% at press time. This development suggested that the people who held Tether had deployed their capital.
Market participants who previously fled to stablecoins have now begun to enter the crypto markets once more, and this suggested that some of the fear of the past few weeks could be reduced.
ETH- 1 Day Chart
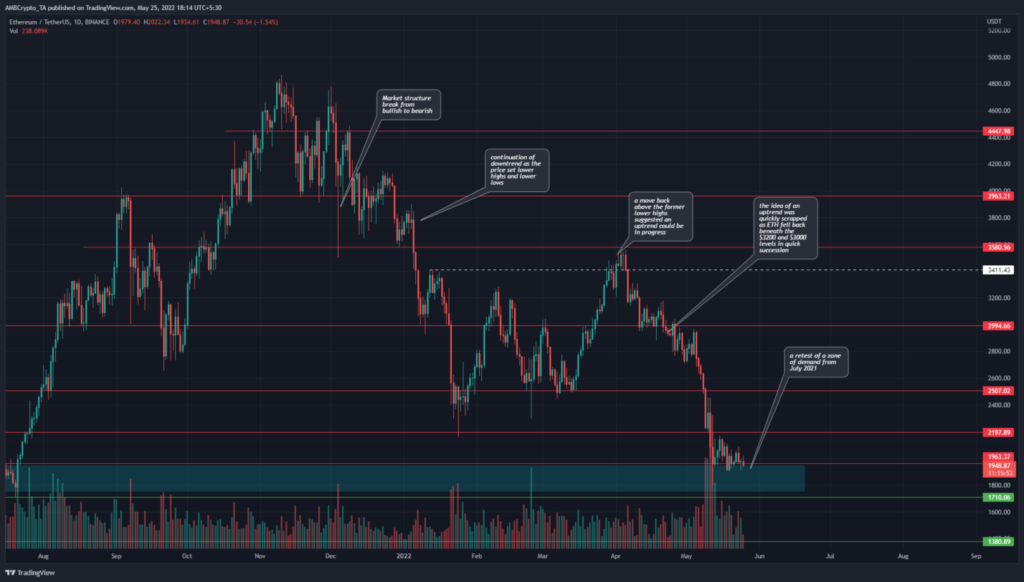
At the end of March, the previously bearish market structure was broken and ETH teased a bullish bias. However, in early April, ETH was forced to break below $3,000, underscoring the strength of the bears. Additionally, previous lows at $2200 and $2500 in January and February respectively have both been broken in recent weeks.
The $1750-$1950 area (cyan box) represents an area of demand that Ethereum rallied strongly from in July and August of 2021. However, as things stand, a rally was not yet evident.
A bullish engulfing candle, for starters, could be a sign of a strong buy. A move past $2150 would not necessarily mean the market was bullish for longer frames, but it would indicate that $2350 could be revisited ahead of another move lower.
Rationale
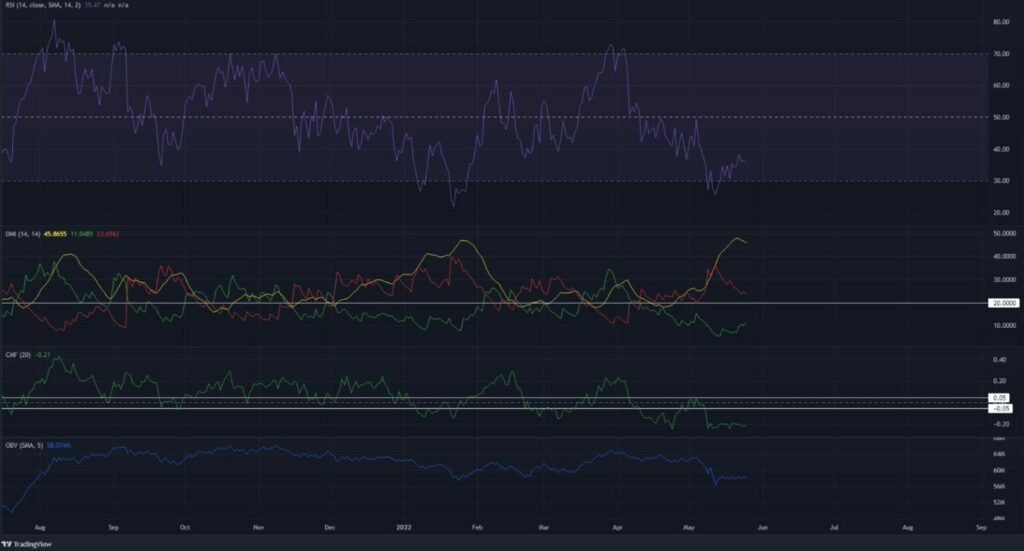
The RSI remained below neutral 50, to show a bearish trend in progress. However, the RSI has been making higher lows in recent days, and this could develop into a bullish divergence if ETH drops below the $1890 mark.
The DMI also showed a strong downward trend underway as the ADX (yellow) and -DI (red) were both above the 20 mark. The CMF was well below the 20 mark. -0.05 for the past few weeks and indicated a large flow of capital out of the market. The OBV agreed with the bearish notion as it saw a sharp drop in the month of May.
Conclusion
A drop below $1900 could see a bullish divergence get reinforced on the daily chart. In confluence with the high timeframe demand zone, a bounce to the $2000 and even $2200 could materialize.
However, buyers should remain cautious of a dip below $1800 for Ethereum as another wave of selling could be a possibility over the next week.


