
Bitcoin continued to trade within a range from $28.7k to $30.6k, while much of the rest of the altcoin market was in a downtrend. Ethereum managed to stave the bears off in the past two weeks after a strong move down from the $3000 level earlier in May. Over the previous day, the sellers seized the initiative and forced ETH beneath a support level of $1960.
The Ethereum market structure on the lower time frame charts was bearish and indicated further losses.
ETH- 1 Hour Chart
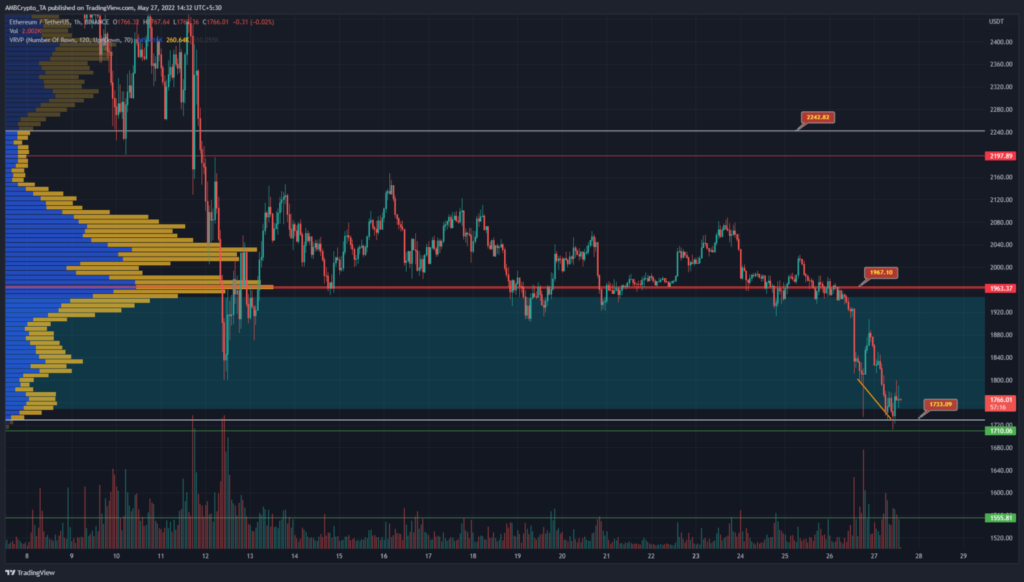
On the lower timeframes such as hourly, Ethereum appeared to form a range between $1900 and $2120. However, over the past week, sellers were able to force the bulls to retreat even at the $2080 and $2060 levels. This suggested that buying pressure had dried up somewhat.
The visible range volume profile showed the highs and lows of the value zone (gray) at $2242 and $1733, with the control point at $1967. This level was the most important support level for the bulls, and it converged with a longer-term horizontal support level at $1963. However, over the past two days, the bears have gathered enough strength to force the price below this support zone.
The $1750-$1950 (highlighted in cyan) has been a zone of demand from July 2021, and the price has dropped as far south as $1710 to test a support level as well. Therefore, in the short-term, a bounce to $1800-$1840 could occur, followed by another move downward.
Rationale
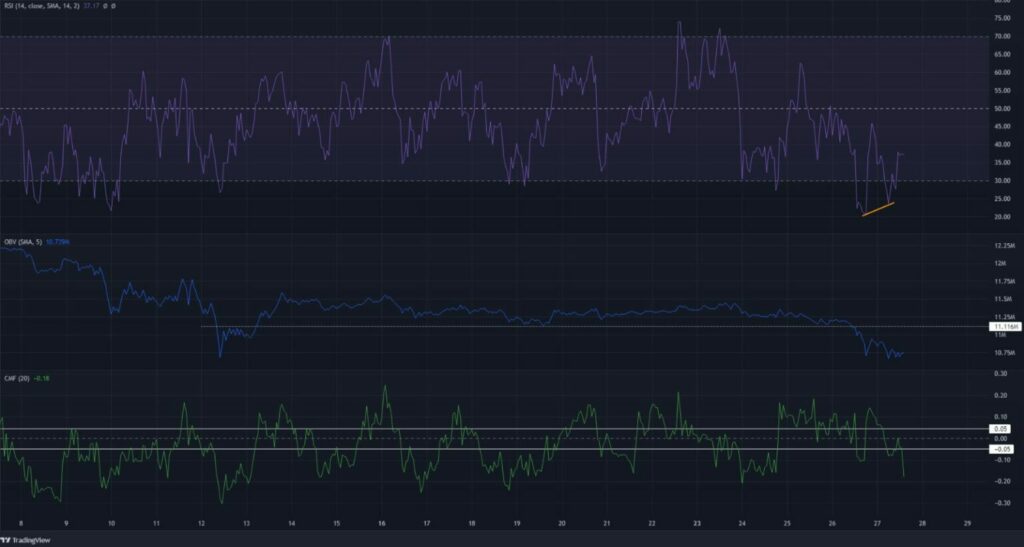
The RSI showed bullish divergence (orange) where the price made lower lows while the momentum indicator made higher lows. This bullish divergence hinted at a pullback towards $1840, but the trend remains bearish. A hidden bearish divergence can be used to signal a continuation of the old downtrend.
The OBV slipped beneath support it has held since 13 May, and this meant that selling volume has been dominant. The CMF dropped below -0.05 once again to show heavy capital flow out of the market.
Conclusion
The bullish divergence meant a rebound was imminent, and the $1800-$1840 area could be a place to enter short positions with a stop-loss at or just above the $1950 mark. To the south, $1710 and $1555 are support levels that ETH is likely to descend to in the coming days.


