
Ethereum [ETH] has seen rough times in recent weeks on the price charts. During the harsh drop on 12 May across the market, Ethereum had managed to hold on to the $1750-$1950 support zone. Even as June dawned, the price held on to this demand zone, but the buyers were exhausted within a week into June. The altcoin, once again, cratered to dip as low as $881 just a few days ago.
The trend favored sellers and shorting the asset appeared to be the safest trade over longer time frames.
ETH- 1-Day Chart
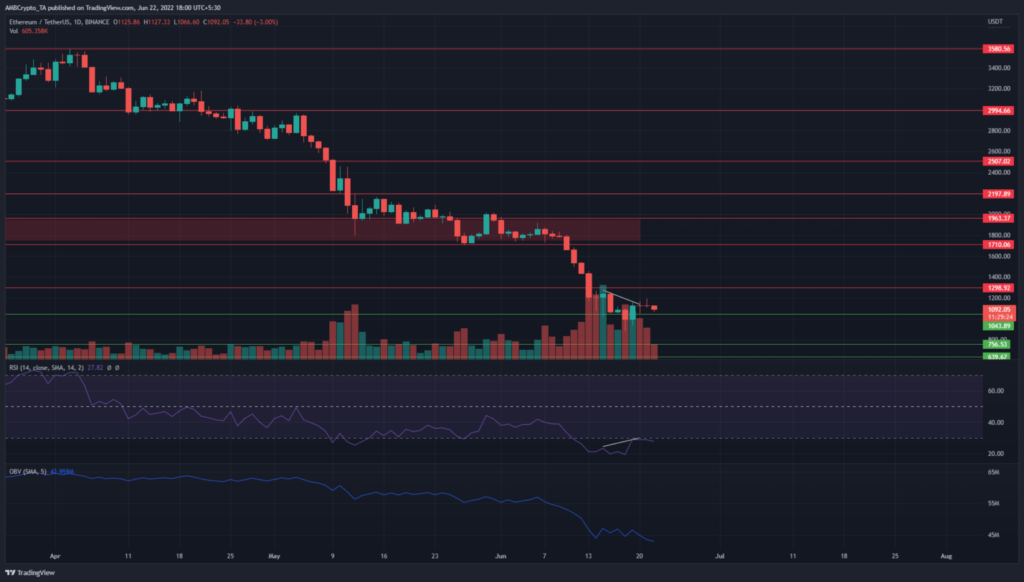
On the daily timeframe, the downtrend was clearly seen. It was characterized by a series of lower highs and lower lows. The latest of these lower highs sat at $1,284, while the more prominent recent lower high lay much higher at $1,920.
Therefore, it can be said that the long-term trend would continue to tilt downwards until ETH can break above the $1,920 mark. However, such a wide margin of error would be of no use to positional traders.
Development of interest on the daily ETH chart was the formation of a hidden bearish divergence between the price and momentum, highlighted in white. While this could continue to develop for a few more days, it was an early signal that the bearish trend was likely to continue. The OBV also agreed as it slumped lower to show that selling volume outweighed the buying pressure.
ETH- 4-Hour Chart
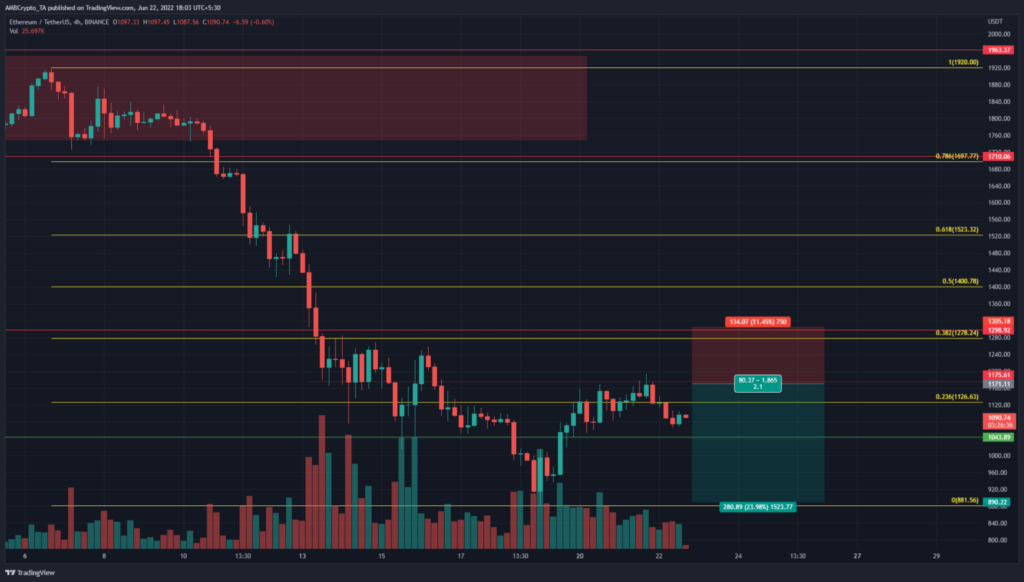
Zooming in on the H4 chart, a set of Fibonacci retracement levels have been drawn. They showed the 38.2% retracement level at $1,278, which was just below the $1,305 resistance and the $1,284 mark.
The confluence of these resistances suggested that ETH bulls would have an exceedingly hard time breaking past this resistance zone. At the same time, the $1,175 level has also been significant in the past two weeks.
Therefore, a risky trade would be to enter a short position below $1,175. More risk averse traders can wait for the hidden bearish divergence to continue on the daily timeframe and look to enter short positions in the $1200-$1300 area, with a stop-loss above $1305. Previous lows at $880-$900 may be retested and may serve as profit.
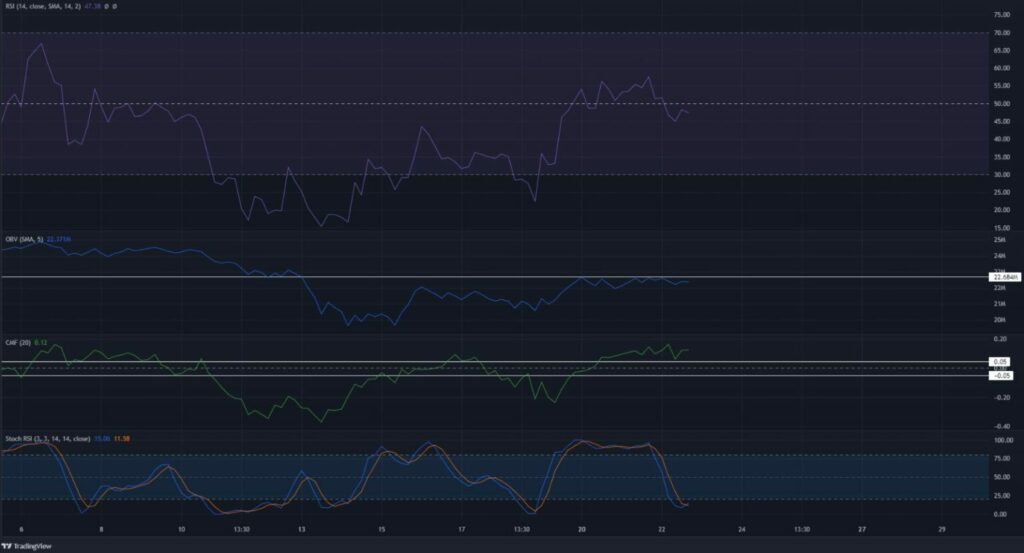
The H4 indicators further showed neutral momentum behind Ethereum. The RSI oscillated about the neutral 50 line over the past few days. The OBV struggled to climb past a resistance. On the other hand, the CMF was able to shove its way above the +0.05 mark. This indicated a strong capital flow into the market.
The Stochastic RSI has also formed a bullish cross into oversold territory. Taken together, a little upward movement might be possible. Still, it probably couldn’t break above the aforementioned resistance zone at $1,250-$1,305.
Conclusion
The longer timeframe bias for Ethereum remained bearish, and buying opportunities were not yet in sight. The four-hour chart suggested some indecisiveness in terms of momentum. Hence, some patience would be needed before entering a short position.


