In today’s on-chain analysis, Be[in]Crypto looks at the unspent transaction outputs (UTXOs) indicator and its derivatives for the Bitcoin network. The goal is to try to compare this indicator for the current bear market with historical data.
We see that today’s UTXO values are characteristic of previous bear markets. However, they have still not reached all-time macroeconomic lows. In turn, this suggests that BTC price could still see a final capitulation before resuming the uptrend.
What is UTXO?
UTXO is a blockchain and cryptocurrency technology term that represents a certain amount of digital currency that has been authorized by one account to be spent by another.
In other words, UTXO is the amount of digital currency left after performing a cryptocurrency transaction. A real comparison could be the change received after making a purchase.
The UTXO model is used in many cryptocurrencies because it allows users to track ownership of all portions of that cryptocurrency. Because cryptocurrencies were created with anonymity in mind, UTXOs are tied to public addresses visible to the entire network.
Bitcoin, for example, is a cryptocurrency that uses the UTXO model. In contrast, an extended version of the UTXO model (EUTXO) is used by the Cardano blockchain.
Percentage of UTXOs in profit
A good measure of the health of the Bitcoin market is the indicator of the percentage of UTXOs in profit, which remains in correlation with market macro trends. This indicator determines the percentage of unused transaction outputs whose price at the time of creation was lower than the current price.
In the long-term chart, we can see that the historical bull markets continued until the UTXO percentage profit chart was above the rising trend lines (red). When there was a breakdown below this line (blue areas), it was confirmation of the start of a bear market. Such a situation occurred in March 2014, January 2018 and most recently in December 2021.
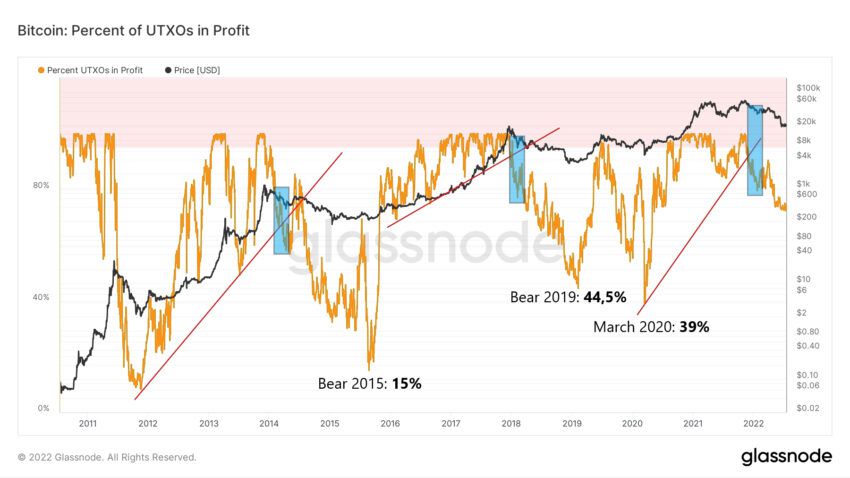
After the first two crashes, deepened declines caused the percent of UTXOs in profit to hit lows of 15% in 2015 and 44.5% in 2019. It is worth mentioning that the COVID-19 crash of March 2020 brought the ratio to 39%.
So far, the 2022 low is only 72%, which is significantly higher than in previous bear markets. This suggests that there is further downside potential in the price of BTC.
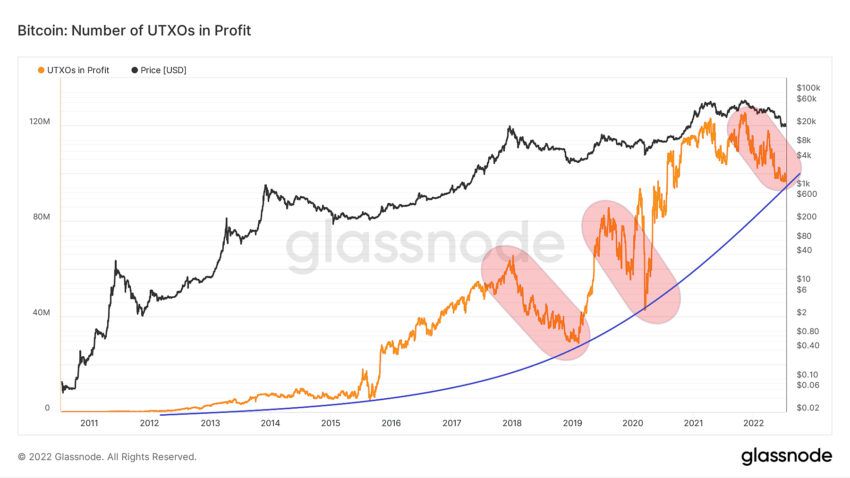
If we now look at the absolute amount of UTXOs in profit, we see that this value has fallen to an almost two-year low. Despite this – as the adoption of the Bitcoin network increases – the indicator remains in a long-term upward trend (blue curve). However, the current correction is the biggest drop since the July 2019 to March 2020 period.
Number of losing UTXOs
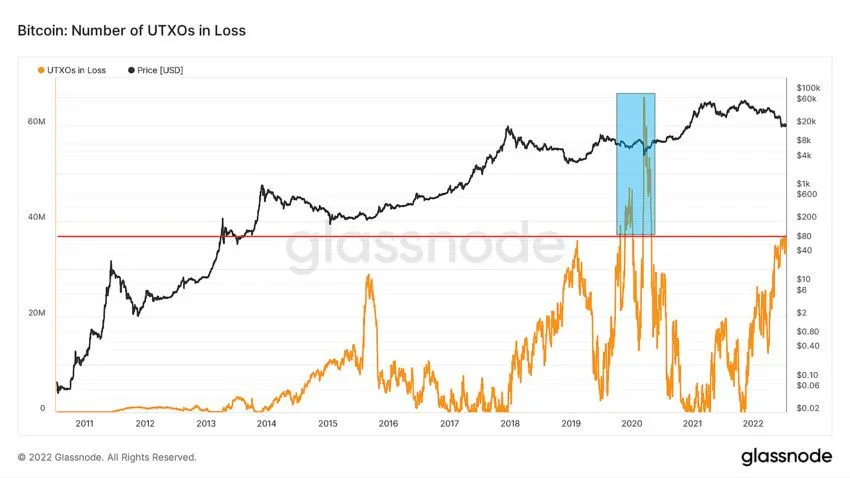
We also see an interesting situation in the indicator of the number of losing UTXOs. Because it turns out that it has exceeded the values of the two previous bear markets of 2015 and 2019 (red line). In other words, the number of unspent trade outflows is now higher than at the macro lows of previous downtrends.
Of course, this is also due to the growth and adoption of the Bitcoin network, which is generating more and more users, addresses and transactions.
Despite this, the current losing UTXOs are still below the peaks of October 2019 to April 2020 (blue area). It also shows that with the current size of the Bitcoin network, there is still a possibility of an eventual capitulation before the downtrend reverses.