
Ethereum [ETH] has, as some Twitter denizens like to say, “melted faces” over the past week as the asset surged from the range lows to post an impressive 50% gain in just under a week.
The longer-term trend has been bearish, dating back to late November. However, the recent breakout of the range meant that the bulls had taken the lead. The price charts offered two areas where buyers could look to top up.
ETH- 1-Day Chart
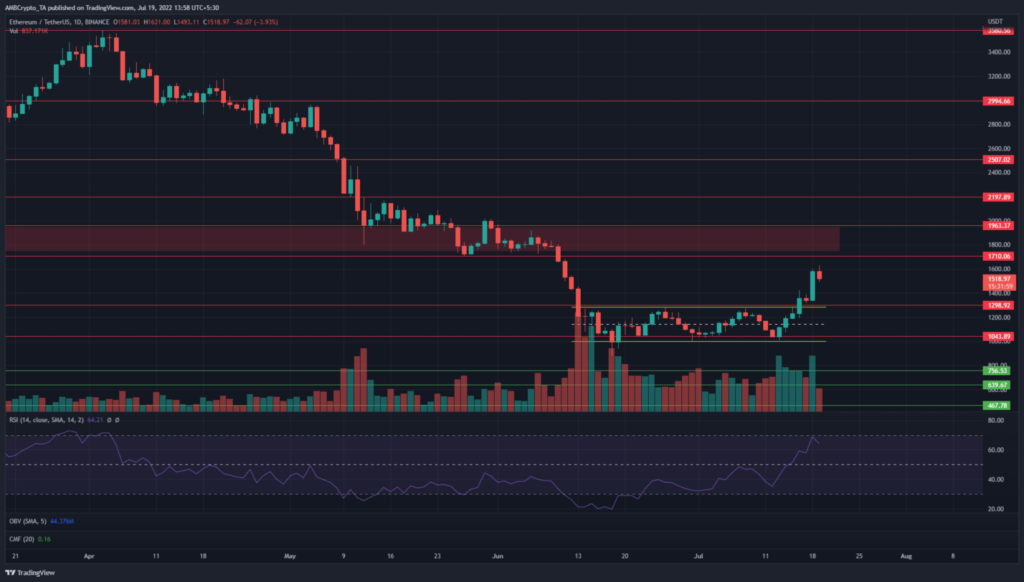
On the daily chart, the most important piece of information was that the $1750-$1950 area represented stiff resistance. In July and March of 2021, this zone served as support and resistance. At the time of writing, it was resistance once more, and a long-term one at that. Hence, this region had extra significance.
Another thing to note is the steady downward trend in recent months, especially in April. In June, the price formed a range (yellow), which Ethereum broke out of during the last trading days.
The Relative Strength Index (RSI) also broke past neutral 50 to show that bulls had the upper hand. This was a welcome change for the buyers, who had toiled in a downward trend since April, evidenced by the RSI’s inability to break neutral 50.
ETH-4H chart
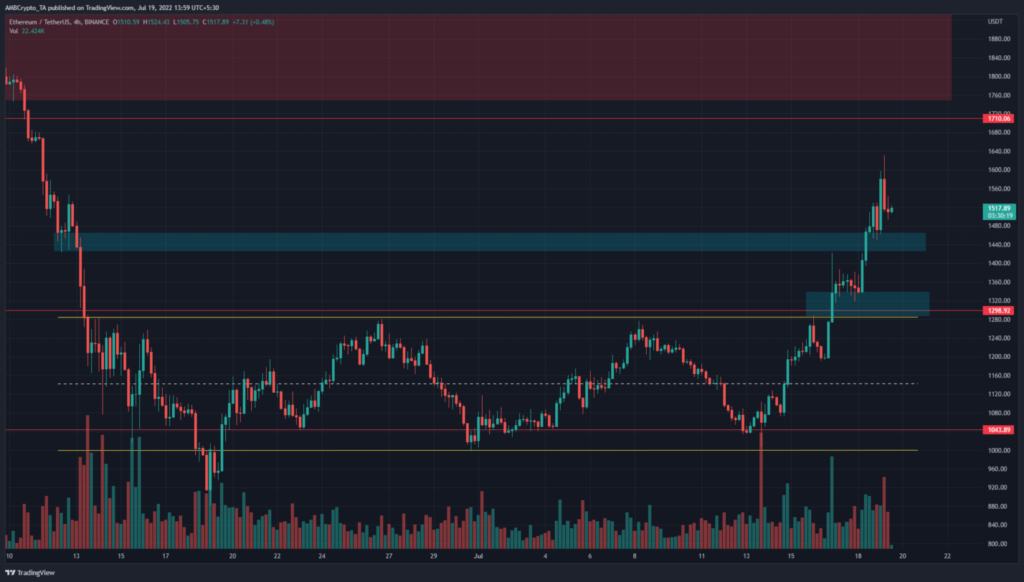
The four-hour chart has highlighted the recent range (yellow) more clearly. The highs and lows of the range are located at $1,280 and $1,000 respectively. The midpoint of the range at $1,140 has also been respected as support and resistance on numerous occasions as the price traded within the range.
This added credence to the idea of a range formation. The recent breakout saw ETH add nearly $300 from the range highs. The width of the range was also close to $300 ($280 to be exact) so a minor pullback could materialize.
In such a scenario, there were two areas highlighted in cyan where the bulls would look to force a higher low. This was the $1,440 area in early June and the highs in the $1,280-$1,300 range.
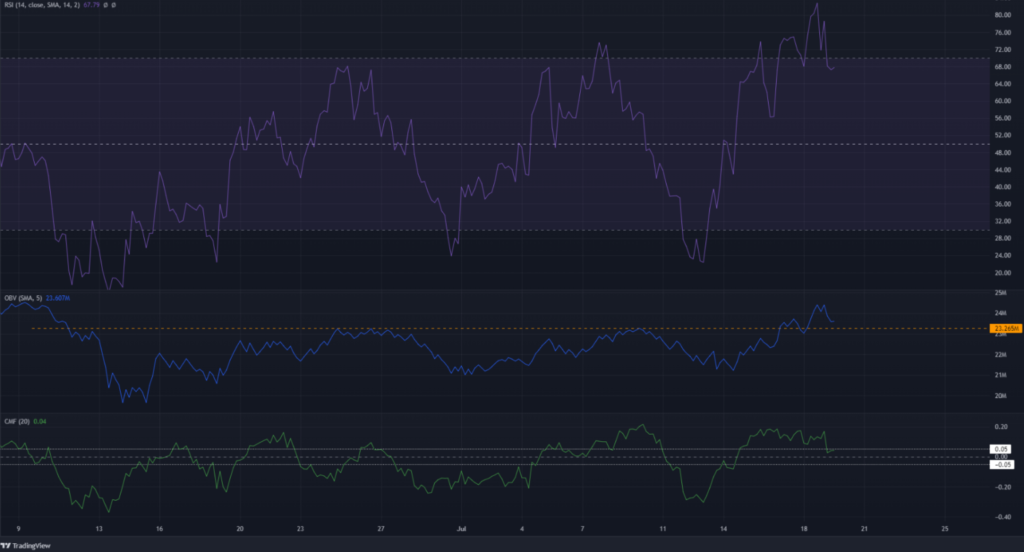
The four-hour RSI was well above the 60 mark to highlight heavy bullish momentum. A hidden bullish divergence (higher low on price, lower low on RSI) could develop in the next couple of days upon a deeper pullback.
The balancing volume (OBV) also moved north. A resistance level from June was broken last week. This indicated the likelihood of further gains for ETH thanks to strong demand.
The Chaikin Money Flow (CMF) also managed to rise above +0.05 to show significant capital flow into the market.
Conclusion
Overall, the longer-term picture was bearish, but recent developments have shown that an upside leg is in the works.
The $1750-$1950 area could be tricky to navigate for both bulls and bears. However, the latest surge for Ethereum meant that a move toward $1800 could transpire in the coming weeks.