
This year has created so many hurdles for the cryptocurrency market, leading top cryptocurrencies, including Bitcoin (BTC) to plummet. The market dominance of Bitcoin hits a 4-year low along with its market capitalization, which is too far from the $1 trillion mark. However, there are some key indicators that bring a ray of hope and a profitable future for bitcoin.
Bitcoin’s historical pattern plays a major role!
according to a tweet Posted by a pseudonymous crypto strategist, Mustache on October 6th, Bitcoin may be following its historical trend as the crypto king previously started a bull run after forming a distinctive pattern in 2015 and 2019 respectively. Bitcoin is now developing the same pattern and is indicating a clear accumulation. It looks like BTC is going to repeat this historical pattern before setting up a bull run this year.
The analyst stated, “The T3-CCI confirms this assumption: red bars in the indicator become shorter. We’re on the verge of a major move.” Furthermore, the analyst also showed the comparison of the pattern formed in 2019 and 2022, hinting at an overwhelming bull run to $60K this year.
A New Bull Run for BTC worth
The price of bitcoin has been negatively affected by some macroeconomic factors including inflation reports and interest rate hikes. However, this is for a short period as several leading crypto analysts are bringing up key factors that have the potential to push the price of bitcoin upwards.
Crypto trading expert, Michaël van de Poppe also mentioned that BTC is getting buying pressure which can act as a catalyst in driving BTC’s price to the North.
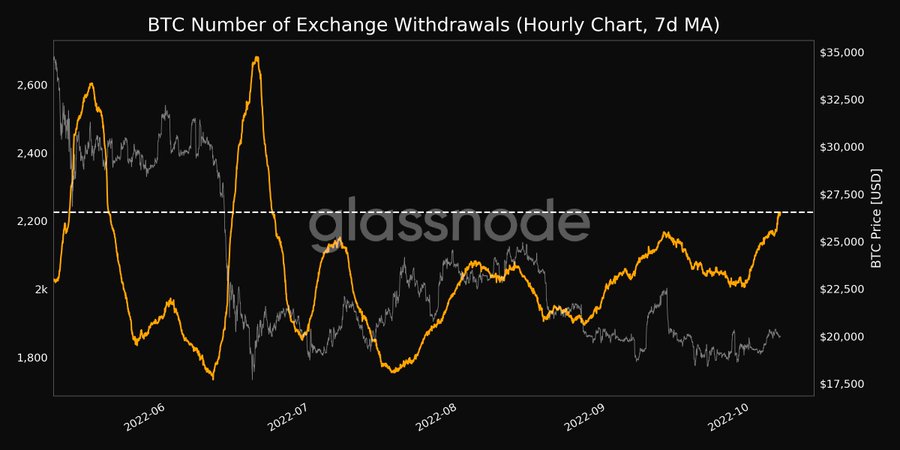
Bitcoin whale movements from crypto exchanges and accumulation have also reached a 3-month peak, which represents investor interest in the crypto market. There are several factors that are helping BTC to create positive momentum in the price graph.
These include the increasing mining popularity despite the ban in China as miners are moving away to continue BTC mining, Bitcoin’s whale accumulation, and Namibia’s government authorizing bitcoin as a mode of payment.
According to CoinMarketCap, BTC recently broke its key price level at $20K, but failed to hold that level as it is currently trading at $19,988, with a market cap of $383 billion. The 50-day SMA (Simple Moving Average) is trading just below the 21-day SMA line, which is indicating a bearish move for Bitcoin soon. If the key resistance at $20.2K is breached, bitcoin could start a bullish rally towards the next resistance at $24.5K.
Conversely, Bitcoin’s current price action hints at a downward correction, which can take BTC to the support level of $18.6K. However, it is advised to research and conduct experts’ opinions before investing in the high volatility of the crypto market.