The worst-than-expected CPI data has caused Bitcoin to experience massive volatility on 13 October. Several prominent crypto strategists and analysts have already predicted the future prices of Bitcoin.
Meanwhile, some analysts are predicting a bullish note as Bitcoin could again see a short-term bullish rally. Tony GhiniaA well-known crypto analyst, now indicates that Bitcoin is set to start a mini-bull run before the bottom is up by the end of 2022.
Bitcoin Is Under Bull Trap!
Bitcoin has been continuously trading in a consolidated zone near the $19K price level, and it may soon form a short-term bullish momentum, predicted by a crypto analyst.
Tony Ghinia, a key crypto strategist who predicted that bitcoin would drop below $10K by the start of the first quarter of 2023, now predicts that the crypto king is ready to jump to an upside before starting a downtrend in the price charts. .
According to his recent tweet, Bitcoin is forming a falling triangle pattern, which indicates a resistance level at a price range of $22K-$24K. Bitcoin is projected to reach this price range by the end of October before starting its bearish journey.
Analysts further predict that this bullish trend may be short-lived as BTC price is expected to move significantly lower in the $14K-$16K price zone by the end of December.
Toni predicts that BTC may have a considerable price recovery by the beginning of 2023 as it can touch a maximum price level between $28K to $30K.
For June 2023, Tony further predicts that there could be another significant drop in the price of bitcoin, touching the bottom line between the $10K to $12K price range.
However, he looks bullish for the rest of 2023 as BTC can have a smooth bull run which will stretch to 2024, hitting a trading price of $26.5K.
What is the technical analysis of bitcoin saying?
Bitcoin investors may be in respite as bitcoin is showing short-term bullish momentum. Bitcoin is currently trading at $19,136, down about 1%, according to CoinMarketCap. However, the candles on the bitcoin price chart may soon turn green as it may attempt to break the $20K price level.
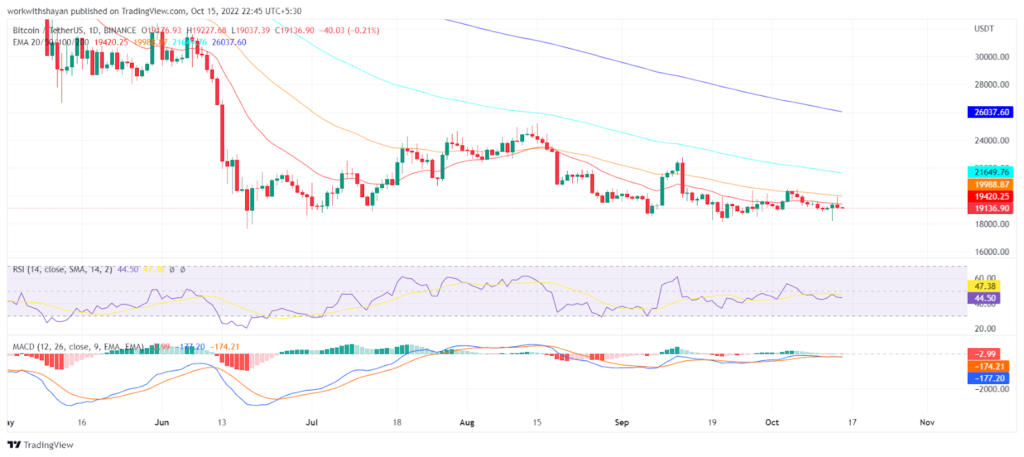
EMA-50 is currently at $19.8K, acting as an immediate resistance level for Bitcoin. If BTC successfully breaks this level and holds its price above it, it can soon make an upward target of $22K.
The SMA-14 line is trading near the 47-level, which indicates stable price momentum for now. However, the MACD line is approaching its trend line, which suggests that Bitcoin may soon hit the upper side.
Conversely, the Bollinger band’s lower limit is at $18K. If the bullish analysis fails, Bitcoin price can drop below $17.5K and may continue to plunge until December.
The RSI-14 indicator is not impressive as it continues to decline and has reached the 44-level. If Bitcoin turns on any negative news, it could see a sharp drop in price and the predicted $10K level in no time.