
The bloodbath of Ethereum seems not to stop even after the much-anticipated merge that took place on 15 October.
The transition from the Proof-of-Work (PoW) mechanism to the Proof-of-Stake (PoS) mechanism did not result in any significant change in the price of Ethereum as it continues to face rejection at the immediate resistance level of $1,350 on the price chart. ,
According to our analysis, Ethereum may bring more bearish woes to investors as it forms a ‘Falling Wedge’ pattern.
Ethereum will soon trade below $1,000!
Bitcoin’s closest rival, which ranks second in terms of market capitalization, may extend its bearish trend as it forms a ‘falling wedge’ pattern in the price chart. In such a pattern, a trend line is drawn connecting all the upper and lower limits of a cryptocurrency. The last meeting point of them indicates the further price movement of that particular crypto.
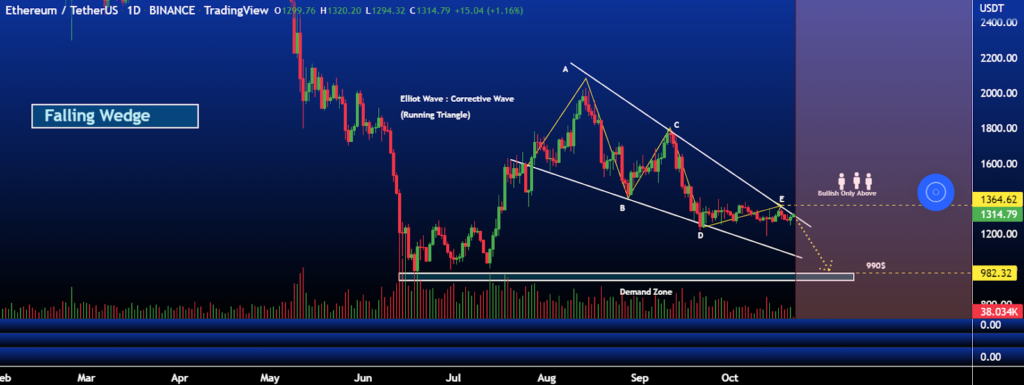
Looking at the daily price chart of Ethereum, the Wedge pattern meets at the downside, indicating a further bearish trend for ETH. To be more specific, the falling wedge pattern indicates a bullish or bearish reversal in the price.
Crypto analysts say that the current bearish trend of Ethereum is going to be bearish if ETH fails to breakout above $1,364, which will push ETH to the bottom line and trade below $990, So indicates a bearish reversal. However, if its price sustains above $1,400, a bull run is expected.
Where Is ETH Price Heading Next?
According to CoinMarketCap, Ethereum is trading at $1,313 with an uptrend of 1.3%. The daily price chart of Ethereum does not look promising, as it hints at selling pressure. EMA-50 trades at $1,384, where the Bollinger band’s upper limit is placed. ETH may end up on a positive note if it holds its price between EMA-50 and EMA-100.
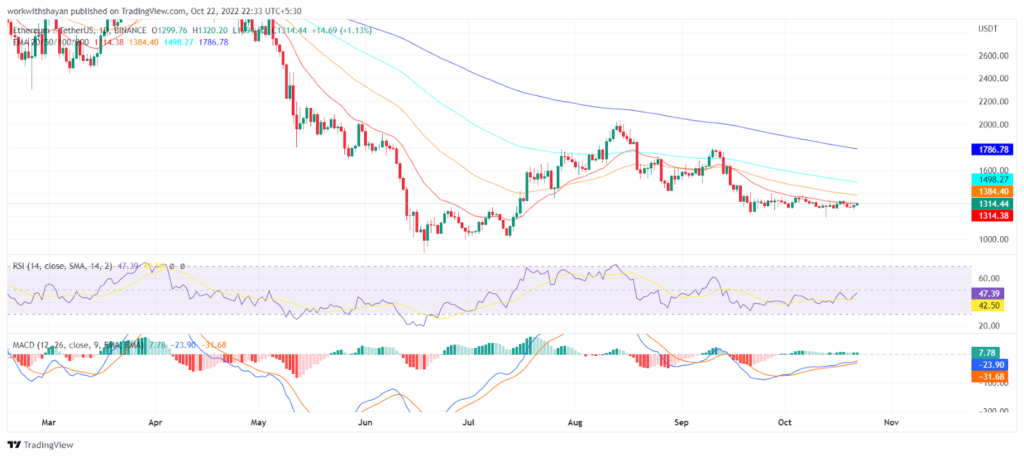
However, the positive momentum is not happening anytime soon as ETH is forming a bearish storm as the RSI-14 trades below the 50 level. However, we can expect Ethereum to make a slight retracement upwards and touch $1,400 before starting a bearish trend. MACD line is moving on the positive side.
The Bollinger Band’s lower limit is at $1,195, which is a crucial support level in the Ethereum price chart. If the support level breaks, Ethereum is expected to witness a sharp fall and take a support level at $998.
However, Ethereum may still have a chance to bring a glimmer of hope due to its Shanghai upgrade in 2023. Ethereum may soon invalidate its bearish analysis and start a bull run depending on the crypto market favorability and future developments.
If everything goes well, we can expect Ethereum to touch the $2,000 mark by the beginning of Q1 of 2023 and may soon break its previous all-time high of $4,878, which was achieved in November 2021.