
This week has been excellent for the entire crypto market as the most dominant cryptocurrencies registered a significant gain in the price chart.
The crypto market in turn gained over 9%, pushing its market capitalization to the $1 trillion level again. Some crypto assets underperformed as Ethereum outperformed its big brother Bitcoin in terms of ROI (return on investment).
However, Ethereum may soon bring some bearish woes as it can trade below $800 if it faces a strong rejection ahead.
A Strong Price Dip Is Coming?
The sudden jump in the prices of many crypto coins in the overall market bearish trend has confused investors to get a clear trend path of Ethereum as ETH continues to fluctuate higher in the price charts.
A leading crypto analyst, Cryptocapo, forecast Ethereum could soon see a sharp decline in the price chart as it recently faced rejection from the $1,600 to $1,650 range.
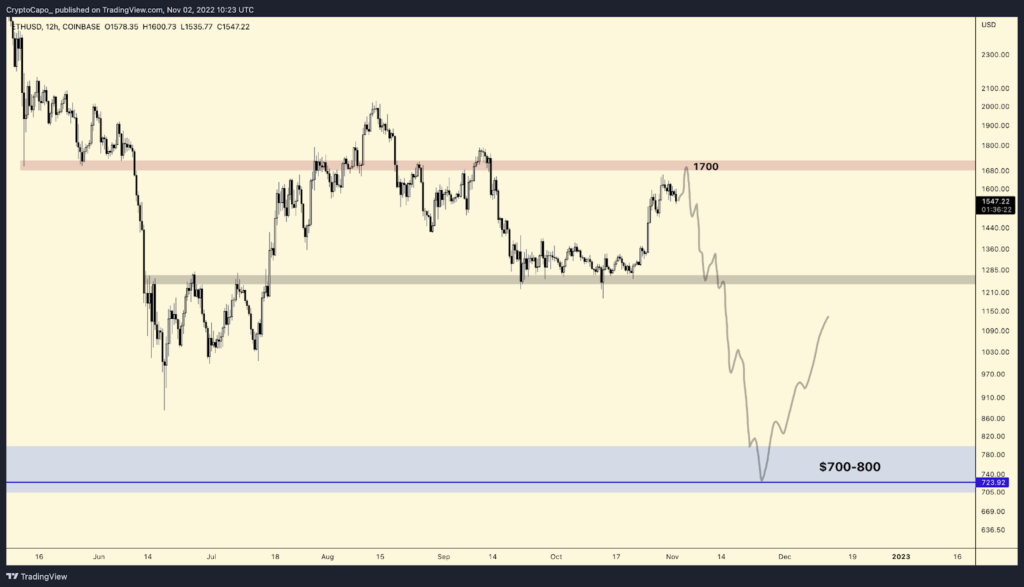
According to the analyst, Ethereum may make a slight upward retracement to $1,700, where ETH will likely face a strong rejection.
Ethereum can be predicted to start a bullish bearish trend if it forms a long bearish candle at its key resistance at $1,700.
The analyst further noted that the ETH price might trade in a bottom range between $700-$800 by the beginning of December.
However, Cryptocapo gave investors some glimmer of hope as Ethereum could be bullish by the end of December, reaching a price range of $1,150.
Ethereum Trades In Critical Zone!
Ethereum selling pressure has eased since the Ethereum merge event
Grayscale stated, “Without the constraint of miner sell pressure, ETH’s price is now potentially more exposed to larger positive movements.”
According to CoinMarketCap, ETH is currently trading at $1,560, down 0.73% from yesterday’s price.
Looking at the daily price chart, Ethereum made a bearish candle after facing rejection at $1,600 level and dropped to its current price level of $1,560.
ETH price tested its resistance at the 61.8% Fibonacci retracement level, but it failed to hold its price above the 100-SMA (simple moving average).
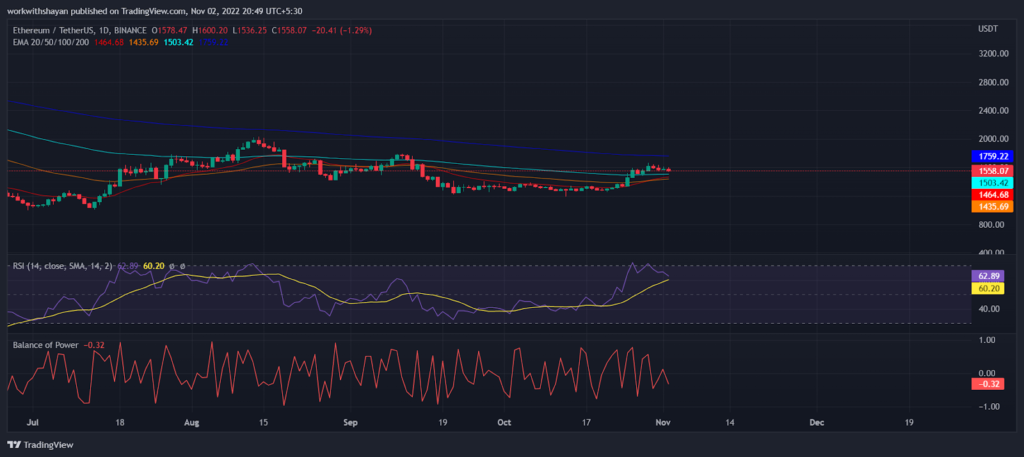
Our technical analysis reveals that Ethereum may witness a slight upward trend before going for a bearish momentum as the RSI-14 trends at 62-level, indicating a bullish territory for Ethereum.
To extend the current bullish trend, Ethereum needs to break the upper boundary of its Bollinger Bands at $1,670 and keep its price above it. If this situation unfolds, Ethereum could move towards its next resistance at $1,760.
However, the above bullish analysis may fail if Ethereum drops more by market sentiments. The BoP (Balance of Power) indicator trades in a negative zone at 0.32, representing a bearish sign.
The lower boundary of the Bollinger Bands is $1,468, which is an immediate support level on the price chart. If this support level is broken, Ethereum could extend its bearish trend and trade below $1,300 again.