The last month brought a bullish recovery for several cryptocurrencies, including Bitcoin, as it held its price in positive territory by gaining 5.89% in its value.
However, the Federal Reserve’s decision to raise the interest rate by 75 basis points to control inflation triggered a new slowdown for the BTC price from early November.
Several traders and investors are now wondering about Bitcoin’s future price movement amid negative market sentiments.
Bitcoin has reached the ultimate resistance zone!
With the start of November, crypto analysts and strategists in the region have been busy sharing their opinions and predictions on the future course of the crypto market.
A prominent crypto analyst, CryptoCapo, conducted an in-depth analysis of BTC’s previous price movement in 2022 and predicted that Bitcoin is all set to form a lower high before plunging hard to the bottom level.
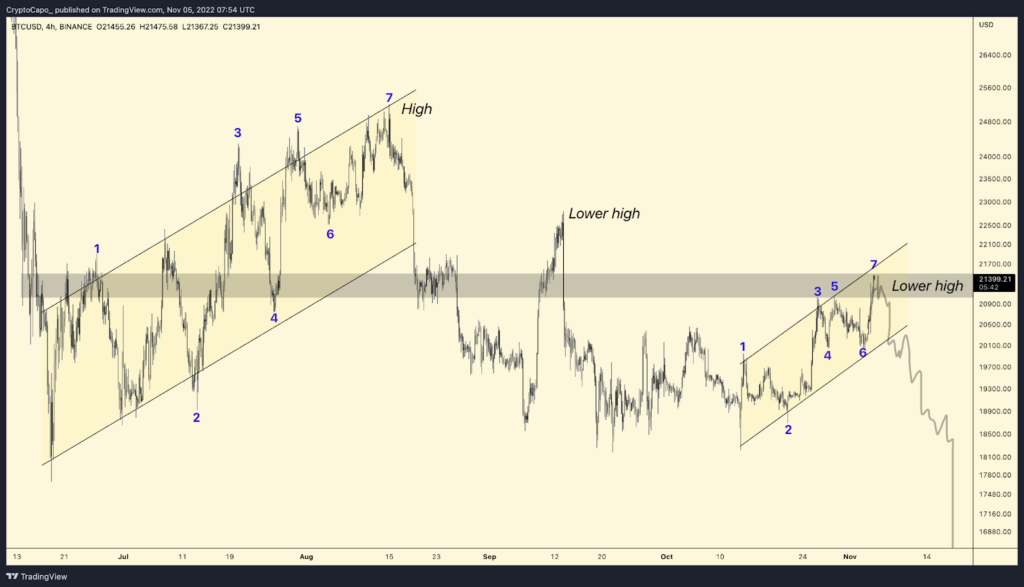
According to him, the downside resistance pattern of bitcoin price has remained in place since July.
CryptoCapo predicts that the current resistance point has entered the final capitulation zone as BTC will likely make another resistance at $21.4K and witness a sharp decline below the price of $16K by the end of next week.
In addition, another crypto strategist, Cyplos, analyzed The weekly RSI level for BTC is forming a descending pattern, which indicates a sharp decline in the bitcoin price for the next week.
Where Is Bitcoin Heading Next?
Bitcoin has gained the spotlight in terms of price fluctuation in the last 24 hours as it shows hope of upward momentum after ending its descending triangle pattern.
According to CoinMarketCap, Bitcoin is currently trading at $21,284, a gain of 3.41%.
Looking at the daily price chart of Bitcoin, BTC recently broke its immediate resistance level at $21K and is continuing to trade upwards.
Bitcoin has formed a strong bullish candle near the EMA-100 trend line, indicating further bullish momentum on the price chart.
The RSI-14 is hovering around a strong overbought region at 64-level, which can bring a rejection for Bitcoin and slump it hard to the bottom level.
Moreover, the MACD line is now gaining momentum and is entering a bullish divergence zone for bitcoin price.
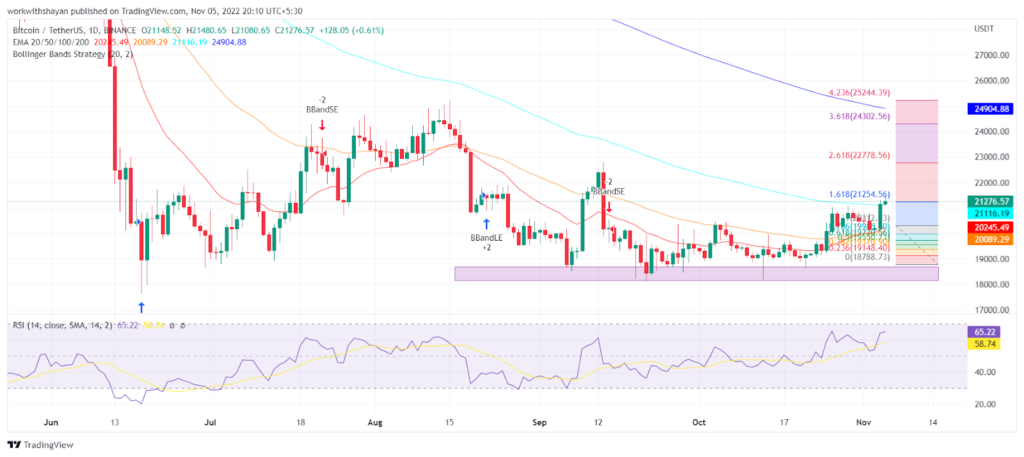
The Bollinger bands are also forming a wide gap in the BTC price chart as the upper limit is at $22.4K, and a breakout above it may lead Bitcoin to its major resistance level of $25K.
Conversely, the lower boundary of the Bollinger Bands is $20.7K, which acts as an immediate support level in determining the future price movement of Bitcoin.
Our technical analysis for Bitcoin reveals a possibility of a bearish trend if BTC fails to hold its uptrend and drops below $20K, which can bring new lows for Bitcoin by the end of this month as it can trade near the bottom of $18K.
It should be noted that the recent upward trend could be a trap of whale investors by moving huge funds amidst the impact of CPI data on the crypto market, leading to a pump-and-dump situation.
Investors are advised to do their own research before investing in the current volatile situation, which can erase all the funds.