
Over the last 100 days or roughly three months, bitcoin’s market dominance among 21,958 different crypto assets worth roughly $850 billion has been under 40%. Bitcoin dominance has been under 40% since Aug. 27, 2022, with a brief instance of rising above the 40% range 52 days ago, on Oct. 15.
Bitcoin’s market supremacy lost 41% in 35 months
The market capitalization of bitcoin has been above the $325 billion region since November 29, 2022. At the time of writing, the total market valuation of Bitcoin (BTC) is approximately $328 billion, representing approximately 38.3% of the entire $856,947,917,107 market cap of the crypto economy.
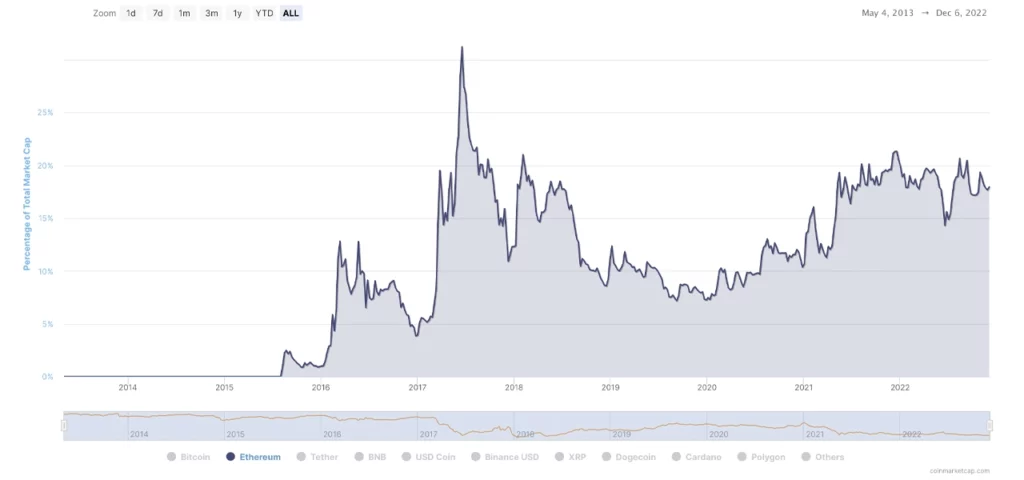
The second leading crypto asset, ethereum (ETH), on the other hand, has a market cap today of around $155.38 billion or 18.1% of the aggregate $856 billion. In the early days, BTC’s market supremacy was above the 90% region from when it first gained value in 2010, all the way up until the second week of Nov. 2014.
Crypto market dominance, among thousands of digital asset market capitalizations, refers to the relative size of coin capitalization compared to the overall market capitalization of the entire crypto economy. After mid-November 2014, BTC’s market dominance fell below the 90% zone but remained above the 80% threshold until the first week of March 2017.
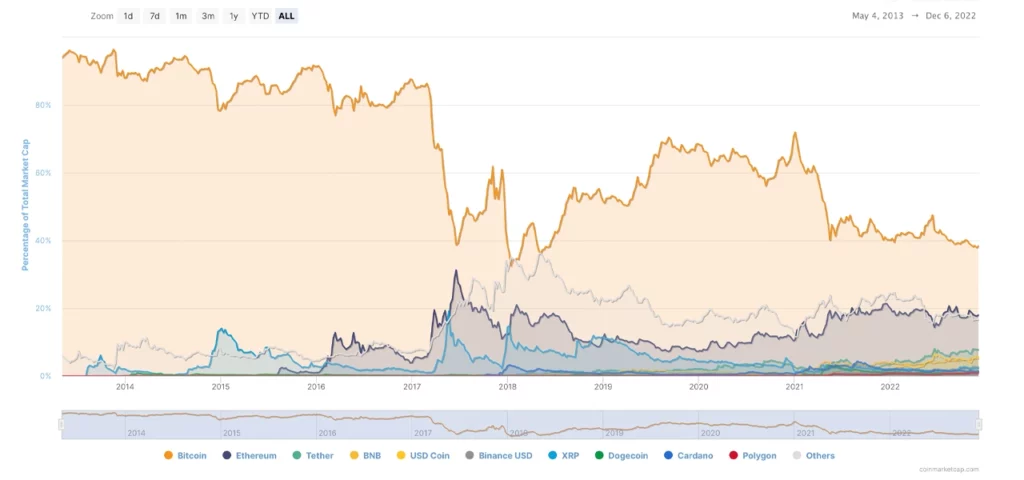
Essentially, during those early days, BTC’s market superiority was 90% for 61 months and after Nov. 2014, it was above 80% for 33 months. However, there were a brief few instances in Jan. 2015, March 2016, May 2016, and Sept. 2016, that saw BTC’s market dominance drop below the 80% region.
Bitcoin dominance has been below 80% for 68 months now, and it has struggled to maintain the 40% range in recent days. Between May 15, 2021 and August 27, 2022, BTC’s market dominance in terms of capitalization was above the 40% threshold, roughly 15 months.
Ethereum, Tether, and Dogecoin Market Dominance Levels Rise
Today, it’s been more than a solid three months of BTC dominance below the 40% range and dominance has not been this low since May 2018. From a logarithmic perspective, ethereum’s (ETH) market dominance, among all the other digital assets, has shown a significant rise since Jan. 2020.
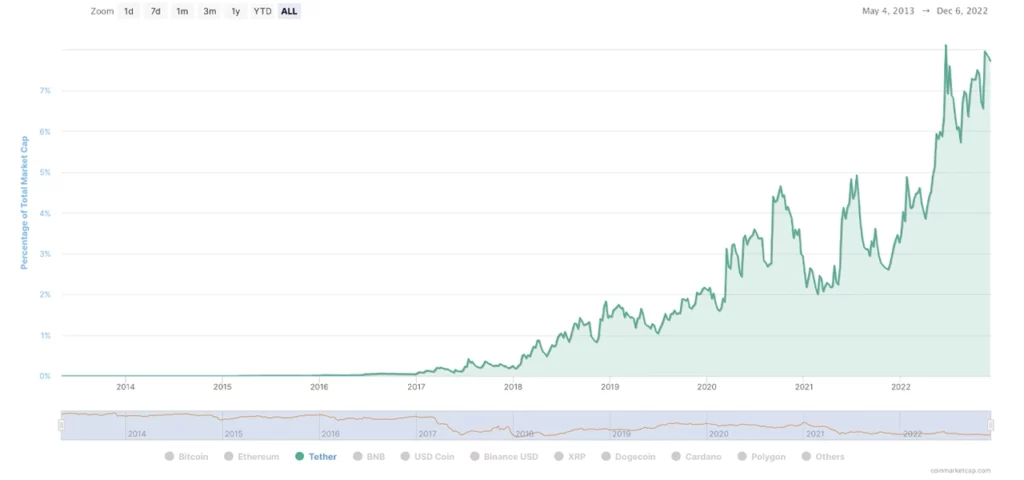
ETH dominance increased by 130.86% since January 2020, while BTC dominance gradually decreased by 41.96% over that time frame. Tether (USDT) market dominance jumped 285% from January 2020 to date, or roughly 35 months, compared to the total value of over 20,000 listed crypto assets.
BNB saw its market dominance grow by 440% over the last 35 months and usd coin’s (USDC) dominance jumped by 2,500%. Like bitcoin (BTC), xrp’s (XRP) market supremacy has dropped during the last 35 months, sliding 47% since January 2020.
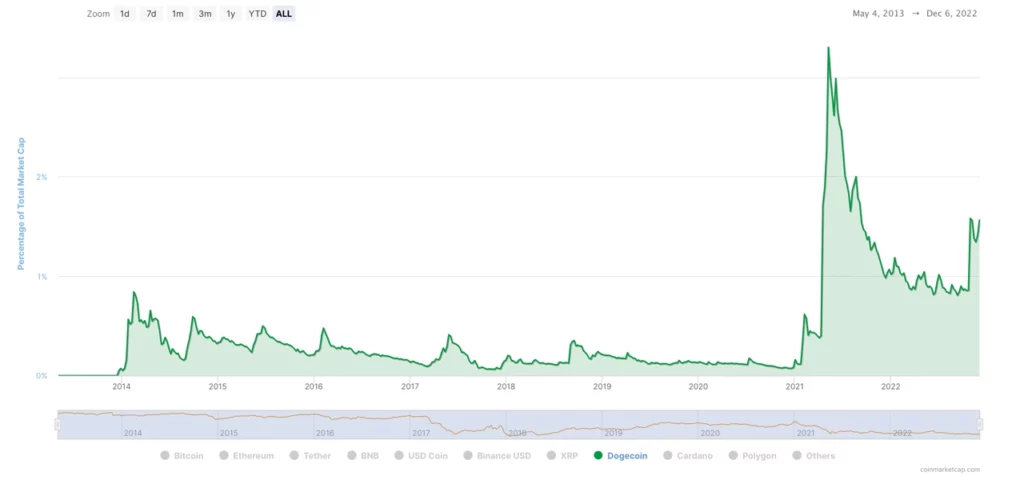
BTC and XRP have seen the worst decline in dominance levels among the top ten digital assets in terms of market valuation. The dominance level of the meme token Dogecoin (DOGE), on the other hand, increased by 1,100% during the last 35 months.
There’s a great deal of people who don’t put much value into market capitalization and dominance data when it comes to digital currencies. For instance, a bitcoin maximalist would say that BTC’s market cap is all that matters, and others may say that a meme coin like DOGE shouldn’t be compared to blockchains that were not meant to be a joke.
However, many crypto proponents believe that the level of market dominance provides meaningful data. For example, Bitcoin and Ethereum can be seen as having high market superiority levels against their rivals, which can have a significant impact on the market. More often than not, when BTC and ETH prices go up or down, alternative crypto assets follow the market patterns of the major cryptos.