
Bitcoin has been trading sideways for the past few weeks, and some investors are becoming increasingly impatient waiting for a new bullish cycle. However, according to some analysts, Bitcoin’s current price action could be forming a fractal that might fuel a move similar to what we saw in 2015, when BTC was trading below the $500 mark.
The prolonged consolidation that we are seeing now might become the foundation for a massive price increase in the future. Even after Bitcoin’s rally in 2017, the cryptocurrency entered a consolidation channel for around a year. This consolidation was eventually followed by a massive rally that propelled Bitcoin to its all-time high of nearly $20,000 at that time.
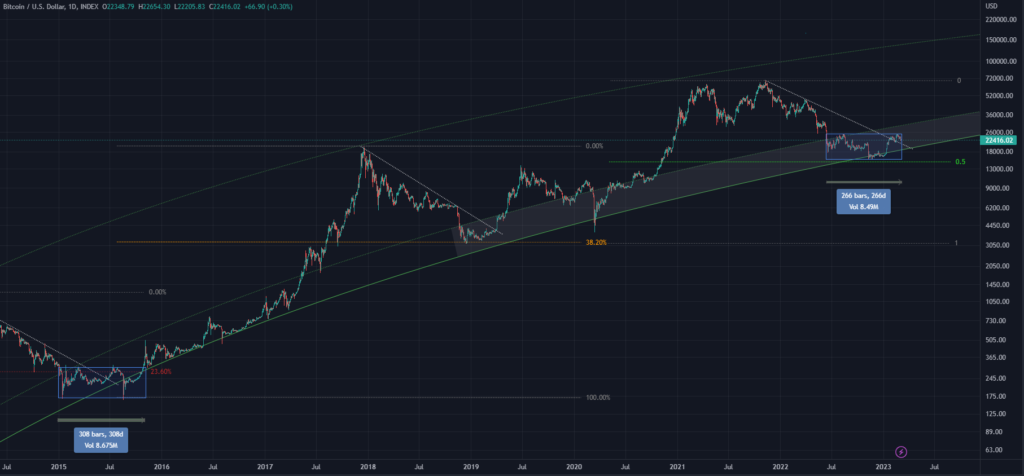
The fractal that analysts are observing on the chart shows Bitcoin’s price action following a similar pattern to what we saw in 2015. If this fractal continues to play out, we could see Bitcoin’s price move toward the $70,000 threshold.
It is important to note that technical analysis is not an exact science, and fractals are not a foolproof way to predict price movements. However, it is always interesting to see patterns emerge on the chart that could indicate a potential trend.
When analyzing the Bitcoin chart, there are two types of charts that traders usually use: regular and logarithmic charts. Regular or linear charts are the most common type of chart, and they show the price movement of an asset over time on a linear scale.
Logarithmic charts, on the other hand, use a logarithmic scale to show price movements. This means that each point on the chart represents a percentage change in price, rather than an equal change in price.