Unexpectedly, the XRP price chart has shown fascinating patterns that may portend significant future occurrences for investors. A recent breakout and retest above the $0.44 area together with a breakthrough over the 50-day exponential moving average have led to the emergence of an inverted head and shoulders (H&S) pattern, which points to potential price growth for XRP.
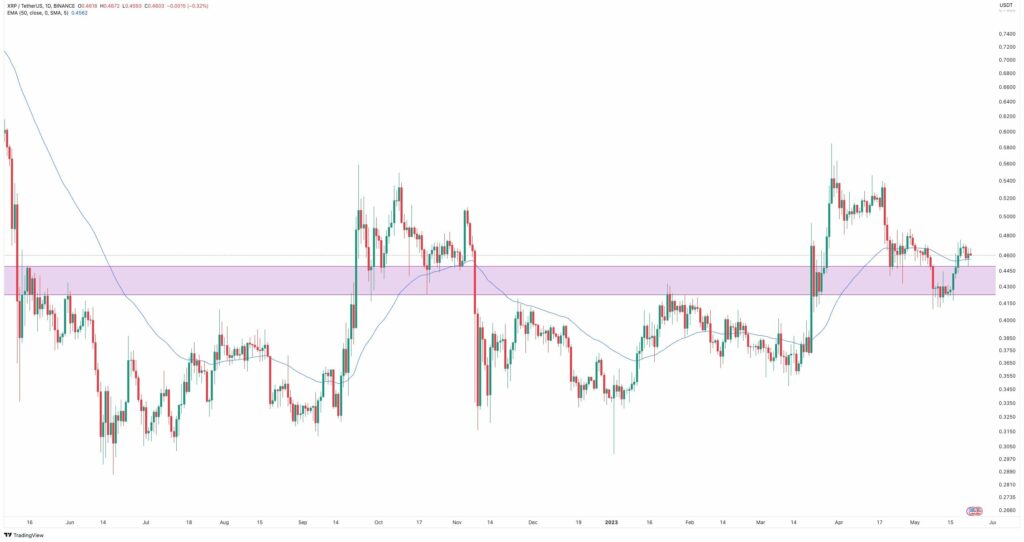
Even if each of these indications is significant on its own, their convergence suggests that XRP’s value is about to increase sharply. However, given the present state of the market and the ongoing legal battle between Ripple and the Securities and Exchange Commission (SEC), market players are confused and interested in the construction of such positive formations. Could insiders and market makers be factoring important news that would support an increase in price?
When a same occurrence recently happened in March, investors were likewise anticipating a quick resolution of the SEC lawsuit against Ripple. XRP trading volumes on important South Korean exchanges accounted for more over 30% of total turnover at the time, demonstrating a special interest among Korean investors.
But this time, the circumstances are different; trade volumes and volatility have decreased since the start of spring, and the market itself is more or less in a depressed position. Time will tell if the arrangement on the XRP price chart justifies itself, but it could be prudent to continue monitoring the token’s media coverage.