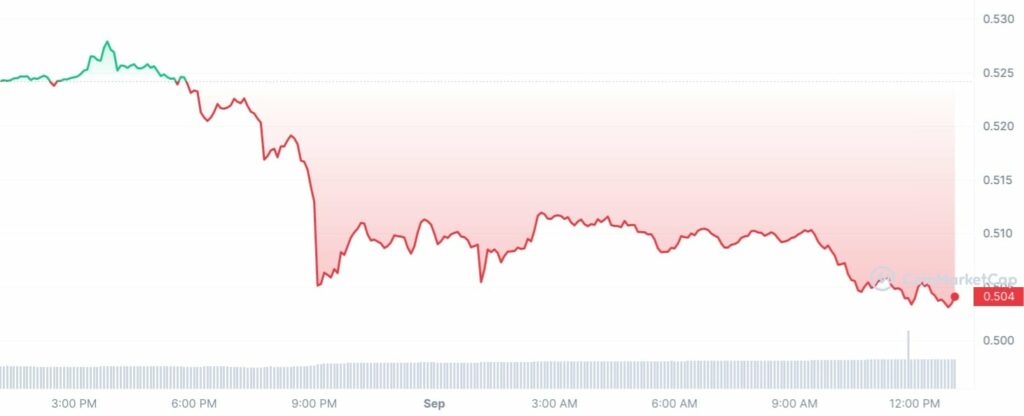
XRP supporters and investors were welcomed with a red candle in the first few days of September as the cryptocurrency’s value dropped by more than 1.5%, closing at $0.5 per token. What’s next for XRP is the question on everyone’s lips. Its September performance in the past could hold the key to the solution.
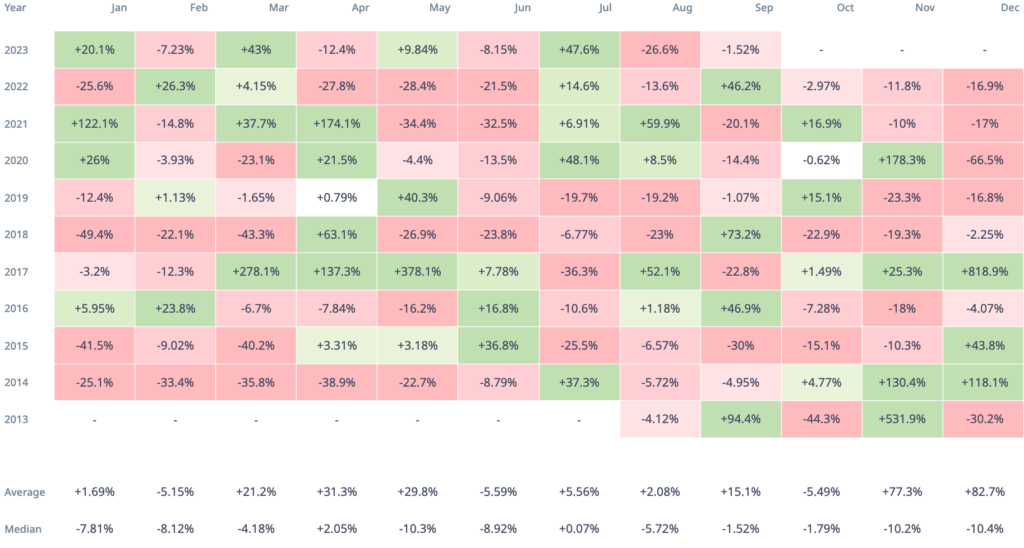
An outstanding number at first look, according to statistics from CryptoRank, XRP has an average return of 15.1% in the ninth month of the year. However, a more thorough investigation of the archives shows a more complex tale. In the past, XRP has typically ended the month of September in the red.
Since 2013, the Septembers of 2013, 2016, 2018, and 2021 have been particularly strong months for XRP, with gains ranging from 46.2% to an astounding 94.4%. The next six Septembers, on the other hand, all had losses, resulting in a median profitability of -1.39%.
This pattern shows that, relative to its closing price in August, XRP is more likely to conclude September in the red. These historical variations show that the bitcoin market is far from being a precise science.
Although statistics offer useful information, the cryptocurrency industry is frequently influenced by unforeseen variables including legislative changes, market sentiment, and outside events. Thus, while the past might act as a guide, it does not fully depict the trajectory of XRP in September.
Holders and dealers of XRP must keep a close eye on the markets as the month progresses in the hopes that September’s past trends will not always predict its present.