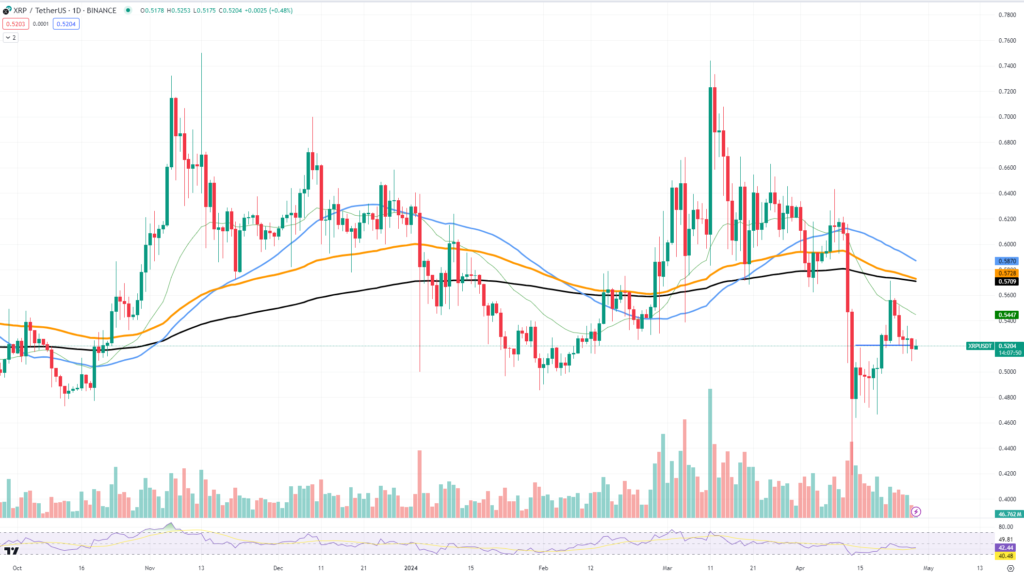
Recently, there has been a hint of a potential reversal in XRP’s chart. Its daily candlestick has turned green, a hopeful indication that suggests the short-term market outlook is about to change. This shift occurs in the midst of declining trade activity, which may cause market observers to exercise caution.
The trend in trading volume at the moment might indicate a lack of confidence in the price change or just a pause before further significant moves. The probable crossover of the 100- and 200-day EMAs is an important factor to take into account in this research. When the shorter-term 100-day EMA crosses below the longer-term 200-day EMA, it frequently indicates a major change in market momentum and a negative outlook.
Looking ahead, a 50 and 200-day EMA crossover in the upcoming months may serve as an even more potent sign of a long-term declining trend for XRP. This would probably validate a long-term pessimistic outlook.
XRP is now attempting a support level that is close to $0.52. If this level holds, it’s possible that XRP will try to go up towards the current resistance level, which is $0.5728. If this barrier is successfully broken, there may be room for more gains, with the $0.57 resistance being a possible target.
But if the support isn’t strong enough to act as a floor, XRP’s value can drop towards lower support zones, which might be located at the psychological $0.5000 level. Though the minimal trading volume and approaching EMA crossings indicate that it is too soon to push longs on XRP and that there is a good chance of an impending price reversal that will result in significant losses, the green candlestick gives optimism for an upward trajectory.