
Ethereum [ETH] concluded June with a 27% bearish push in the last five days of the month after enjoying a brief relief rally. The bearish end of June resulted in the token dropping below $1,000, followed by a pullback. Could this be a sign of a strong buy wall within the $1,000 price level?
June was one of the most bearish months for ETH in recent history. It fell from a monthly high of $1,972 at the start of the month to a monthly low of $881 on June 18. ETH fell below $1,000 twice in the same month. Both cases resulted in a quick recovery above the same price level.
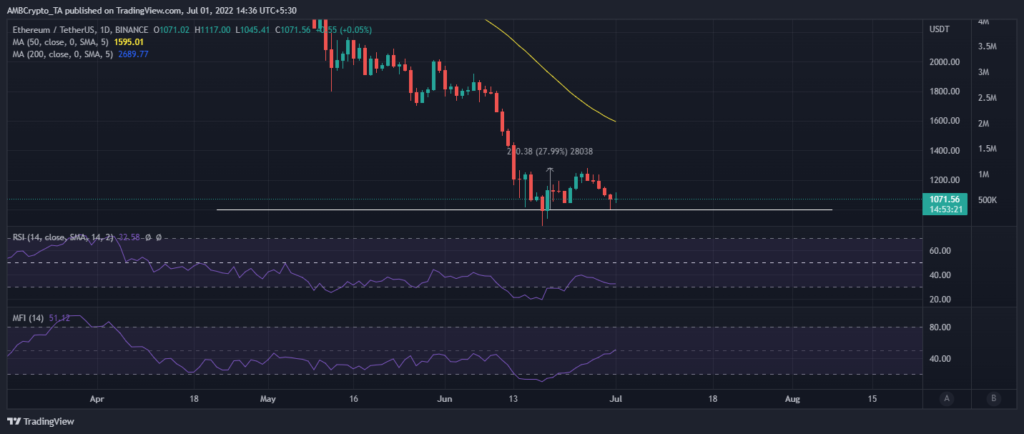
ETH’s end-of-June performance reveals that the price had a higher low, while the RSI hovered just above the oversold zone. Furthermore, the MFI’s uptick, despite the sell-off, confirms that investors have been buying up ETH at lower prices.
A look at ETH addresses confirms that accumulation has exceeded selling over the past 24 hours, resulting in strong support near $1,000. However, it also reveals that active addresses have declined, reflecting volatile market conditions.
Active addresses dropped sharply from 402,586 on 29 June to 212,569 on 30 June. Sending addresses (addresses offloading ETH) reduced from 182,304 to 92,459 during the same period.
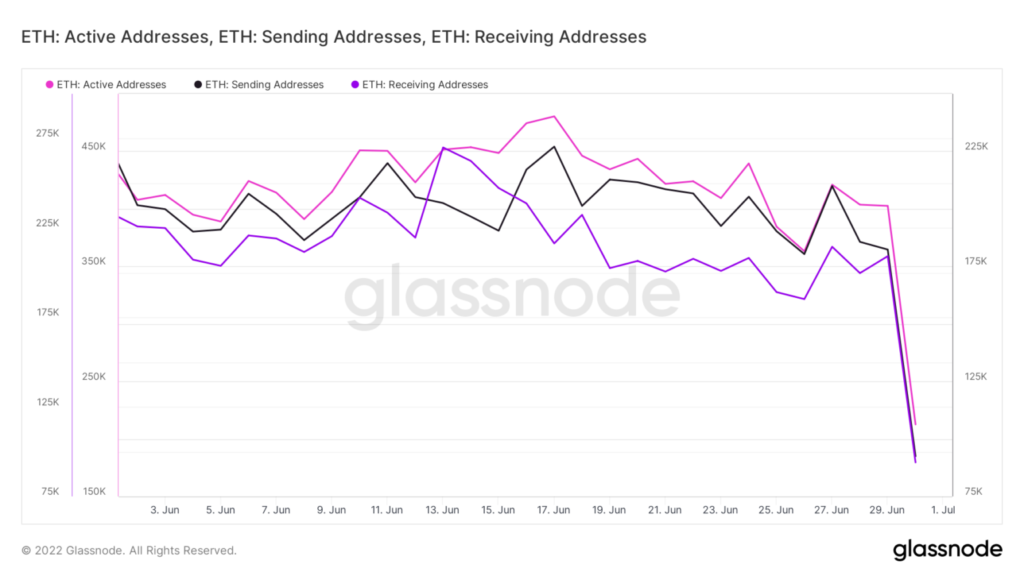
ETH receiving addresses increased from 209,268 on June 29 to 94,002 on June 30. However, the key point to note here is that receiving addresses have slightly exceeded sending addresses in the past 24 hours. Even the whales bought the dip, as the supply of the top 1% address metric indicates. The latter recorded a significant increase from June 27 to 30.
ETH’s last sell-off was characterized by heavy sell pressure coming from the liquidation of long positions. The previous three days of June resulted in an uptick in the number of liquidations from just over $11 million on 27 June to $48.37 million by 30 June.
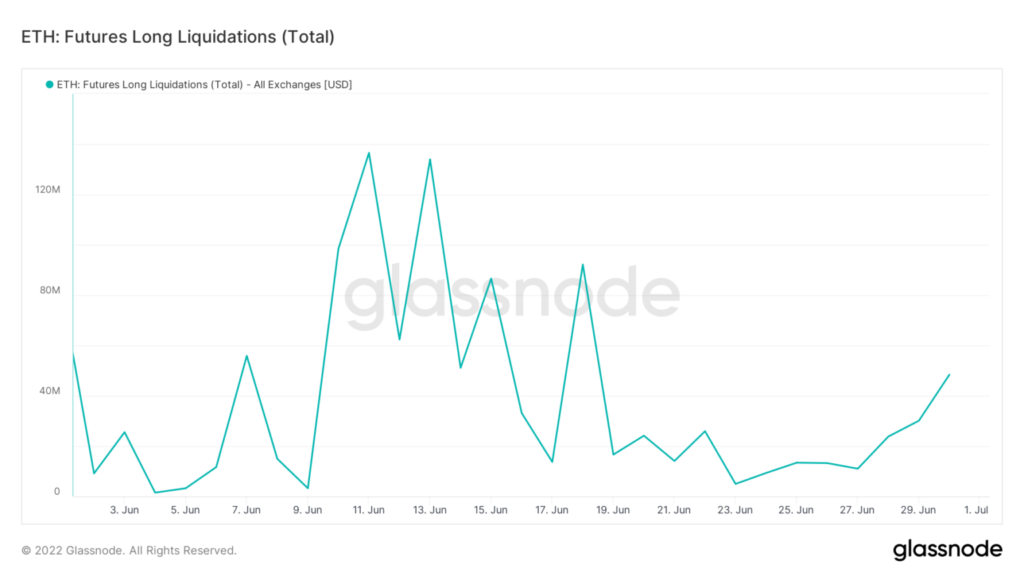
In contrast, the number of liquidations during the mid-June ETH price crash peaked at $136.5 million. This means that we can expect less selling pressure from the liquidation of leveraged long positions on the latest decline.
The futures long liquidations metric reveals why ETH’s latest sell-off was not as severe as the mid-June sell-off. Moreover, healthy accumulation has contributed to the higher lows. Now, it will be interesting to see how ETH will shape up in the first month of Q3.


