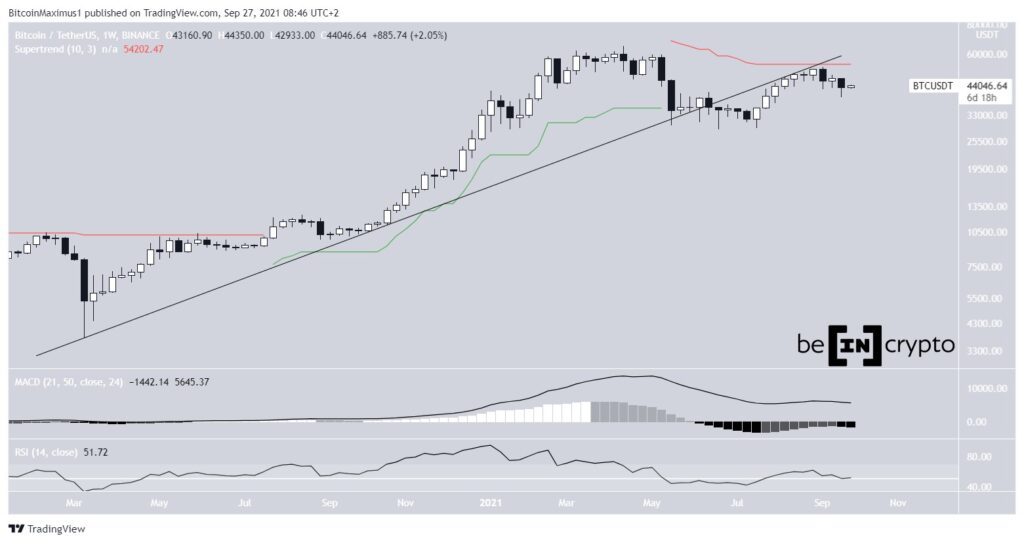
Bitcoin (BTC) declined significantly during the week of September 29-26, falling to a low of $ 39,600 before rebounding and creating a long lower wick.
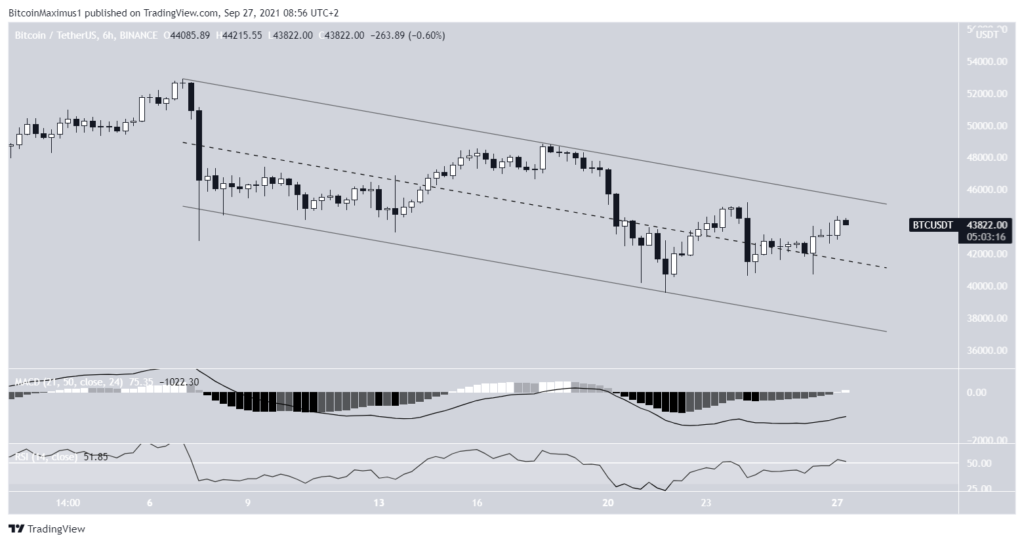
However, BTC is trading inside a short-term descending parallel channel, from which an eventual breakout is expected.
Weekly BTC Outlook
BTC has declined since breaking an ascending support line and validating as resistance. This also coincided with a rejection from the Supertrend line (red line), which is bearish.
On September 26, BTC created another bearish candlestick, although it has a long lower wick.
The RSI and MACD are providing mixed signs. The MACD is positive but falling and has yet to provide a bullish reversal signal. The RSI has moved above 50 but is not showing strength.
Therefore, an examination of the lower timeframes is necessary in order to more accurately determine the direction of the future trend.
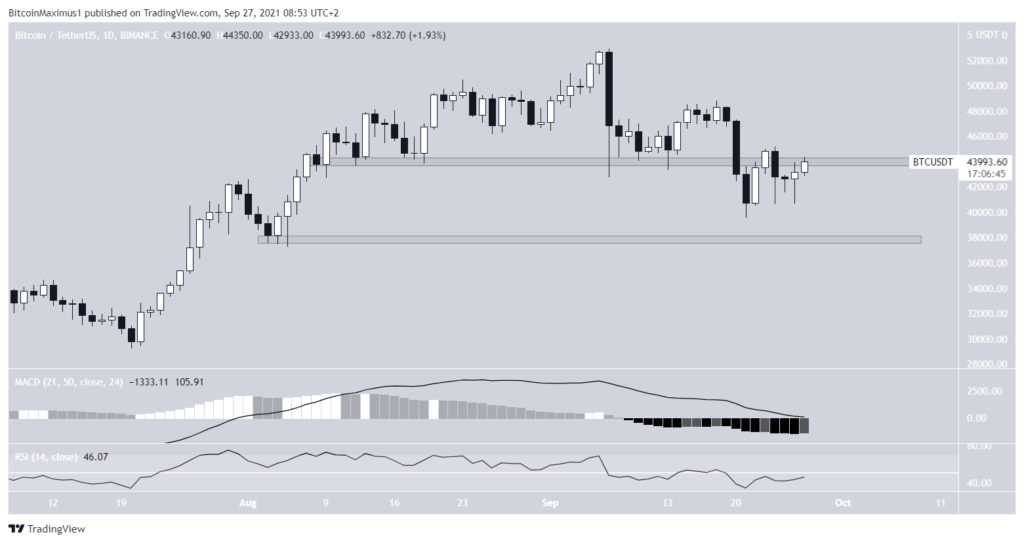
Attempt to reclaim support
The daily chart shows that BTC is facing resistance at $44,000. The area previously served as support throughout August and September when BTC went down.
It made an unsuccessful attempt at reclaiming the area on Sept 24 but was rejected.
Similar to the weekly calendar, technical indicators are showing mixed signs. he MACD is positive but decreasing. The RSI is rising but has not yet crossed the 50 line.
The closest support area is found at $38,000.
Future movement
The six-hour chart shows that BTC has been trading in a descending parallel descending channel since September 7th. Such channels usually contain corrective structures.
Therefore, a breakout of the channel would be the most likely scenario. The wave count also indicates that an eventual breakout is expected.
Additionally, both MACD and RSI increase, supporting the possibility of a breakout.
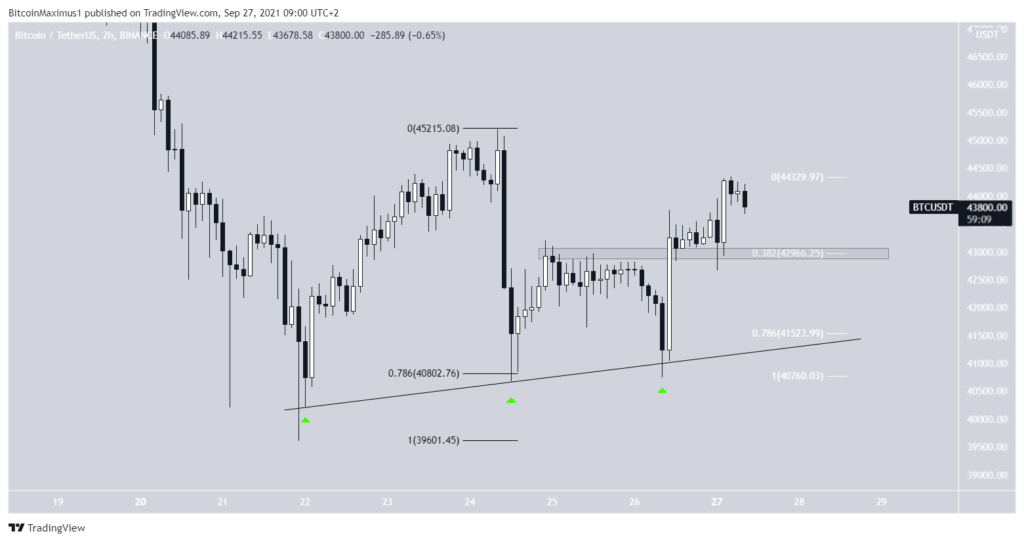
The two-hour chart shows that BTC has bounced at the 0.786 Fib retracement support level and created an ascending support line after. The line has been validated several times (green icons) so far. As long as the support line is in place, the bullish structure remains intact.
There is minor support at $ 42,950. This is the support level of the 0.382 Fib retracement and a horizontal resistance area.
Therefore, the most likely scenario would have BTC bouncing at this area before moving upwards.