
So far, the month of October has belonged to the market leaders Bitcoin and Ethereum. With the top two digital assets making inroads into the new ATHs, other coins were waiting behind the scenes to record their own price hikes. Ethereum’s advance was in the forward direction.
A daily close above $4,000 would allow ETH to march on to newer levels after negotiating past the previous ATH at $4,380. Interestingly, the next RSI spike as well as the MACD crossover could drop some clues as to ETH’s price path. At the time of writing, ETH traded at $3,942, up by 3.5% over the last 24 hours.
ETH daily chart
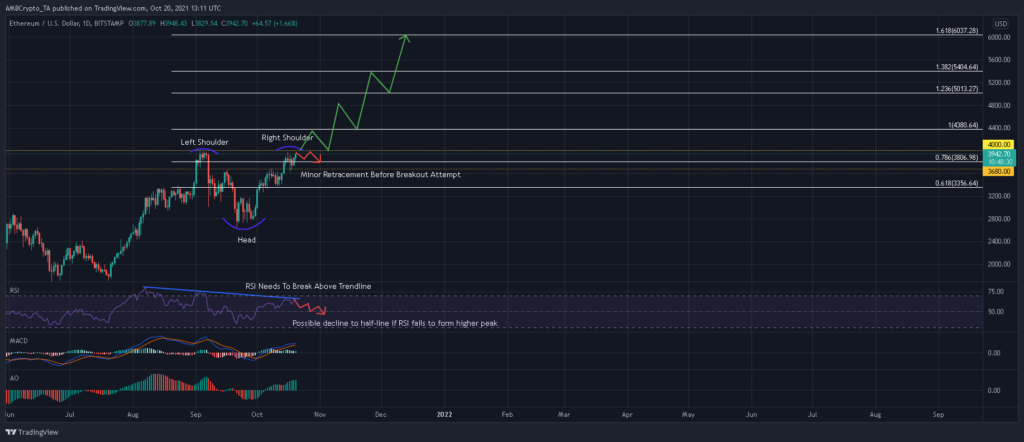
Ethereum’s bullish bias has been discussed at length in previous articles. Now that its head and shoulders pattern was complete, ETH awaited an upwards breakout to unlock its potential. The 123.6% and 138.2% Fibonacci levels could be potential destinations over the coming week, with the 161.8% Fibonacci level serving more as a long-term goal.
However, there were chances of some downside which stemmed from the RSI and MACD. First, overbought readings on the RSI could trigger a slight retracement before ETH embarks on a more “organic” race to a new ATH. Such a development would also see the RSI snap three lower peaks within the upper zone, ranging from mid-August to late-October.
This bearish divergence would not be promising just before ETH challenges a crucial price barrier at $ 4,000. Secondly, MACD was inching close to a bearish crossover while the histogram recorded two lower peaks. While these factors were certainly not enough to reverse the bullish outlook for ETH, they could delay the rise of ETH in the near term.
A rejection at $4,000 would see ETH shift back to $3,680 or even $3,500. From there, the confluence of these support lines and the 20-SMA (red) would present an ideal buy entry before the next breakout attempt. On the other hand, an instant move above $4,000 was certainly a possibility as long as the RSI bests its previous peak around 75.
Such a development would see the RSI scale reach new heights in overbought territory without any fear of a reversal. Moreover, two higher peaks on the Awesome Oscillator suggested that bulls were increasing their position in the market- lending weight to an immediate breakout.
Conclusion
Given that the MACD and the Awesome Oscillator had slightly different outlooks, it was uncertain whether ETH would close above $ 4,000 in the next few days. The RSI could settle the ongoing debate by managing a higher peak above 75. Expect ETH to overdrive once the bulls are able to break through this final hurdle on the RSI.