October, without a doubt, was a time to be remembered for years to come, simply because of the monumental changes that have taken place in cryptocurrency in general, in terms of adoption and boom. While the protagonist over the last one month seemed to be the king coin, Ethereum’s ATH also came close, just before the month closed.
While the top two assets were showing decent gains, the market was still anticipating higher levels and all for the right reasons. In fact, looking closely at Ethereum’s chart it was clear that the top altcoin still had a lot of room to grow. So, will November be brighter for Ethereum than October? Well, looking at the historical data, it looks like ETH could take some staggering action in the weeks to come.
Weekly and monthly close looking promising
Ethereum’s weekly close as October came to an end was the highest weekly close the top altcoin ever saw. ETH’s weekly candle last week closed above $ 4,180, for reference the last highest close when Ethereum did an ATH in May was at $ 3,808.
That wasn’t all though, ETH’s weekly candlesticks have managed to close above $3500 for the last three weeks. In fact, pseudonymous analyst jaydee_757 pointed out that hyper-bullish development is taking place on ETH charts. Noticeably, ETH’s weekly RSI was in a 6-month trendline and had finally broken out, the same signified ETH’s movement.
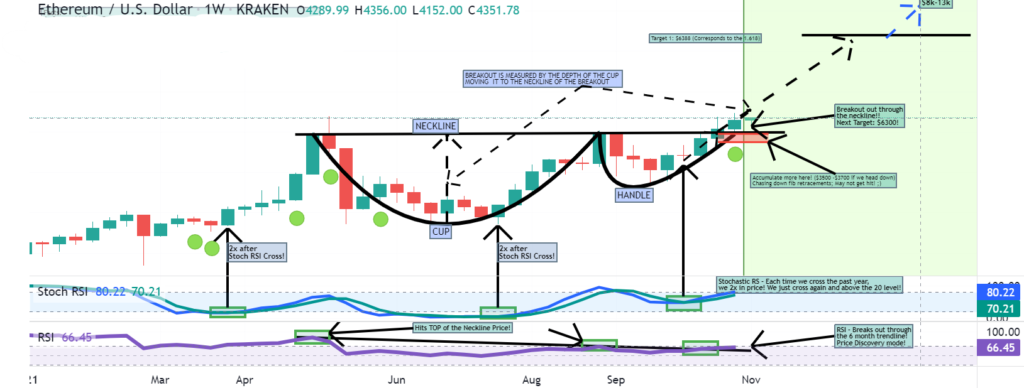
Additionally, the Stochastic RSI has crossed on the weekly chart as seen in the figure above. Each time this cross took place above the 20 level in the past year, ETH’s price saw a 2x in price, the same pattern aligning could mean change Ethereum’s game.
Repeat history?
That being said, a similarity between the price structure of ETH 2017 and 2021 could be noted by looking at the weekly chart. It’s seen that both the times after a consolidation phase roughly starting from June to September ETH saw a local top (in 2021 a new ATH not much higher from the older one though).
After the consolidation and subtle rise in November, the price of ETH exploded, showing gains of 166% as the trend continued through December.
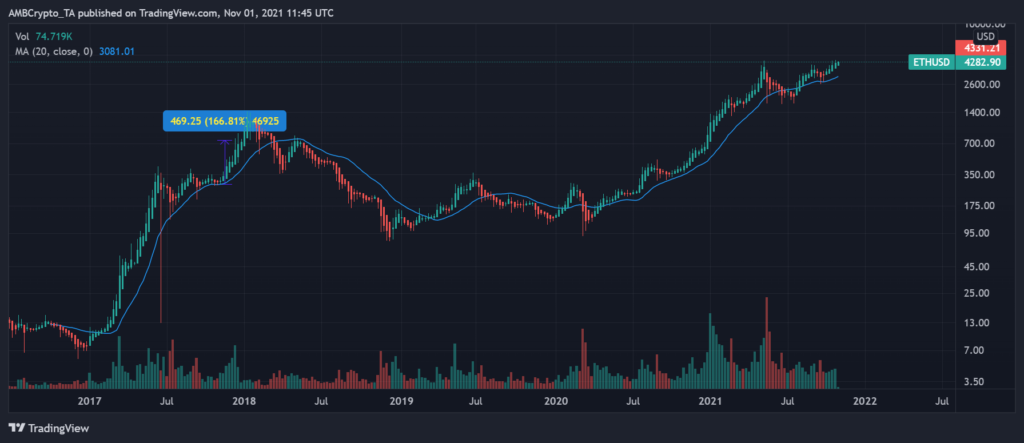
Since there’s a stark similarity in the structure, it is possible ETH could make 100% gains this time too if everything else pans out well.
However, while the outlook for a higher move looked bright, the price of Ethereum after ATH had made a sideways move. With ETH down 4% from its ATH the possibility of a short-term correction couldn’t be discarded.
If the same thing happens, however, it would be a good buying window. For now, since 62.13million (98%) addresses were In the Money, the best thing to do would be HODL.