December was a difficult month for the price of BTC, registering a monthly low on December 4 of just below $ 42,000, according to Bitstamp. There’s just over a day left for this year, and it looks like BTC will end 2021 below the $ 50,000 mark.
Options Market Analysis
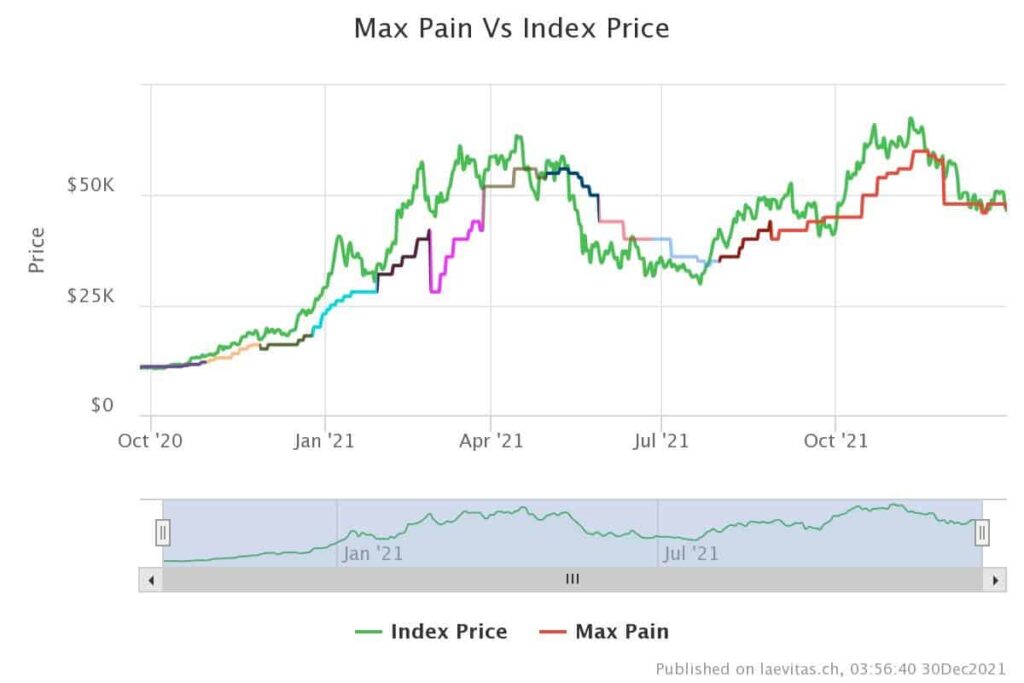
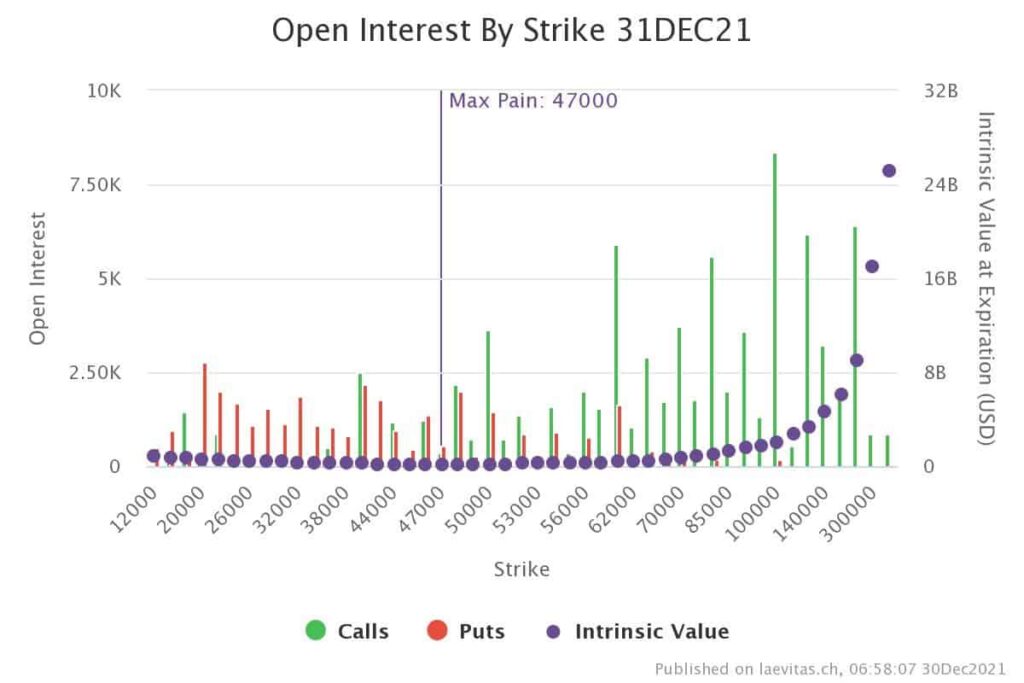
An important factor that should be considered in options market analysis, especially in noteworthy expiries, is the Max Pain Price.
The maximum pain price is the strike price which results in maximum loss for option buyers. The Maximum Pain Theory says that the price of an option will gravitate towards a maximum pain price as the expiration date approaches.
On Friday, 31 of December, massive expiry with a notional value of $5.4B will occur on Deribit Exchange. Max pain price is $47k. Even though it’s hard to speculate about the effect of a massive expiry on the BTC market, better be careful and take preventive actions for possible volatilities that may come immediately after.
Technical analysis
Weekly
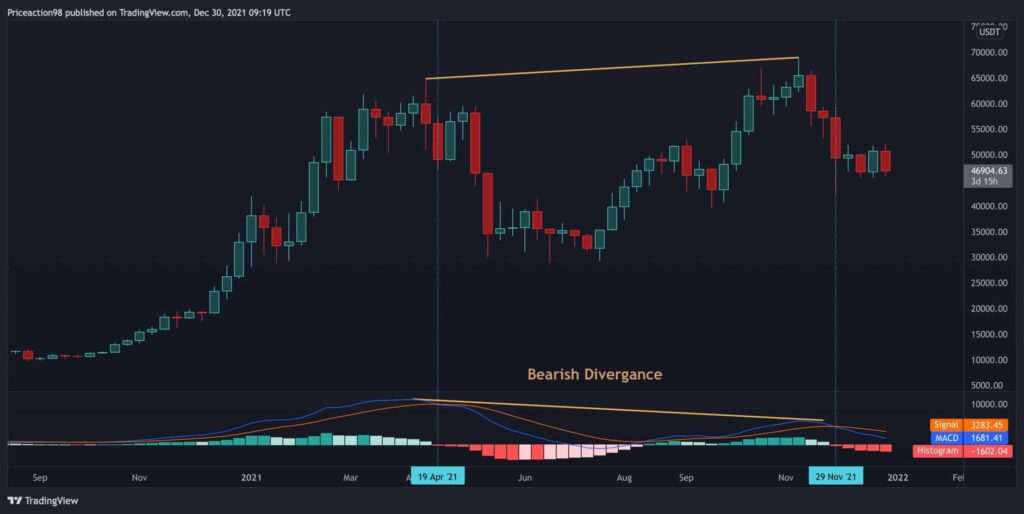
After Bitcoin registered the current ATH of $ 69,000 on November 10, it was quickly rejected and began a bearish movement.
If we look at the MACD indicator, we can observe a bearish divergence with the price, which finally played out and led to a price drop. As can be seen on the chart below, the MACD indicator has recently confirmed a reversal of the mid-term bullish trend, as well as a reversal that took place just before the major crash of May 2021 (marked by blue vertical lines).
The Daily
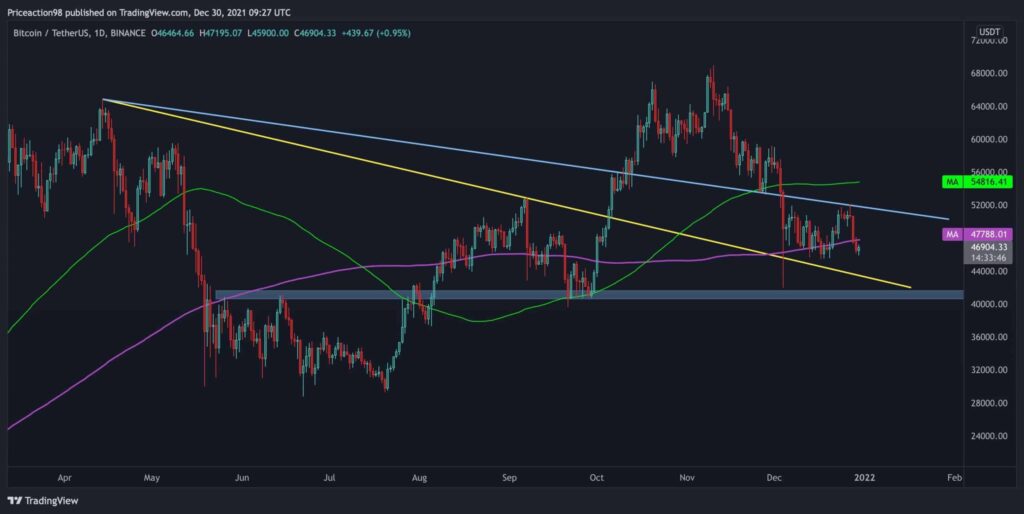
Currently, the BTC price is below the 100-day moving average line (green line) and is grappling with the 200-day moving average (purple line).
The latter serves as a historically significant support/resistance for the price. The blue trendline is currently the next significant resistance for the price, whereas the yellow trendline might be the next major support.
Lower down, the $ 40-41K area is the most robust support area in this range. If BTC drops below that level, it will cause a lower trough, which is a bearish sign, and the path to $ 30,000 can be quick.
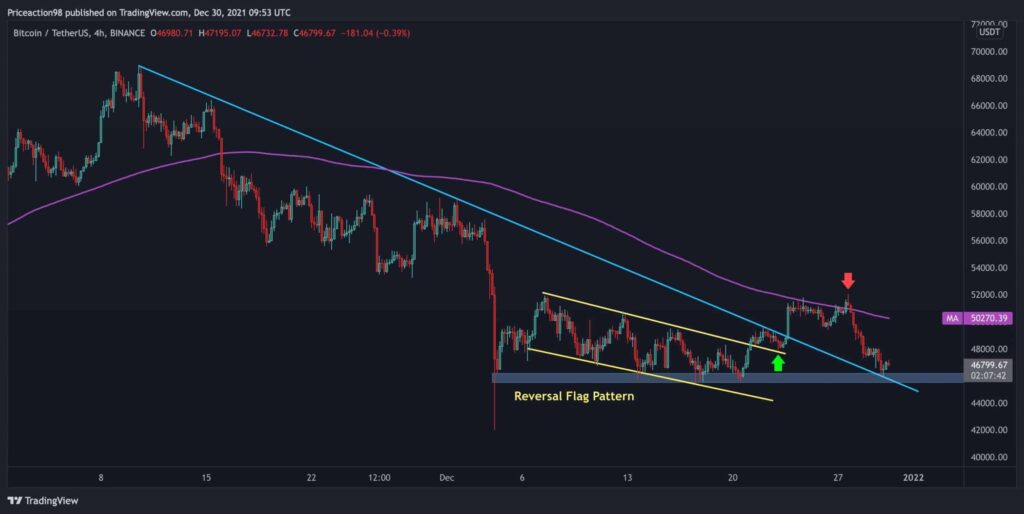
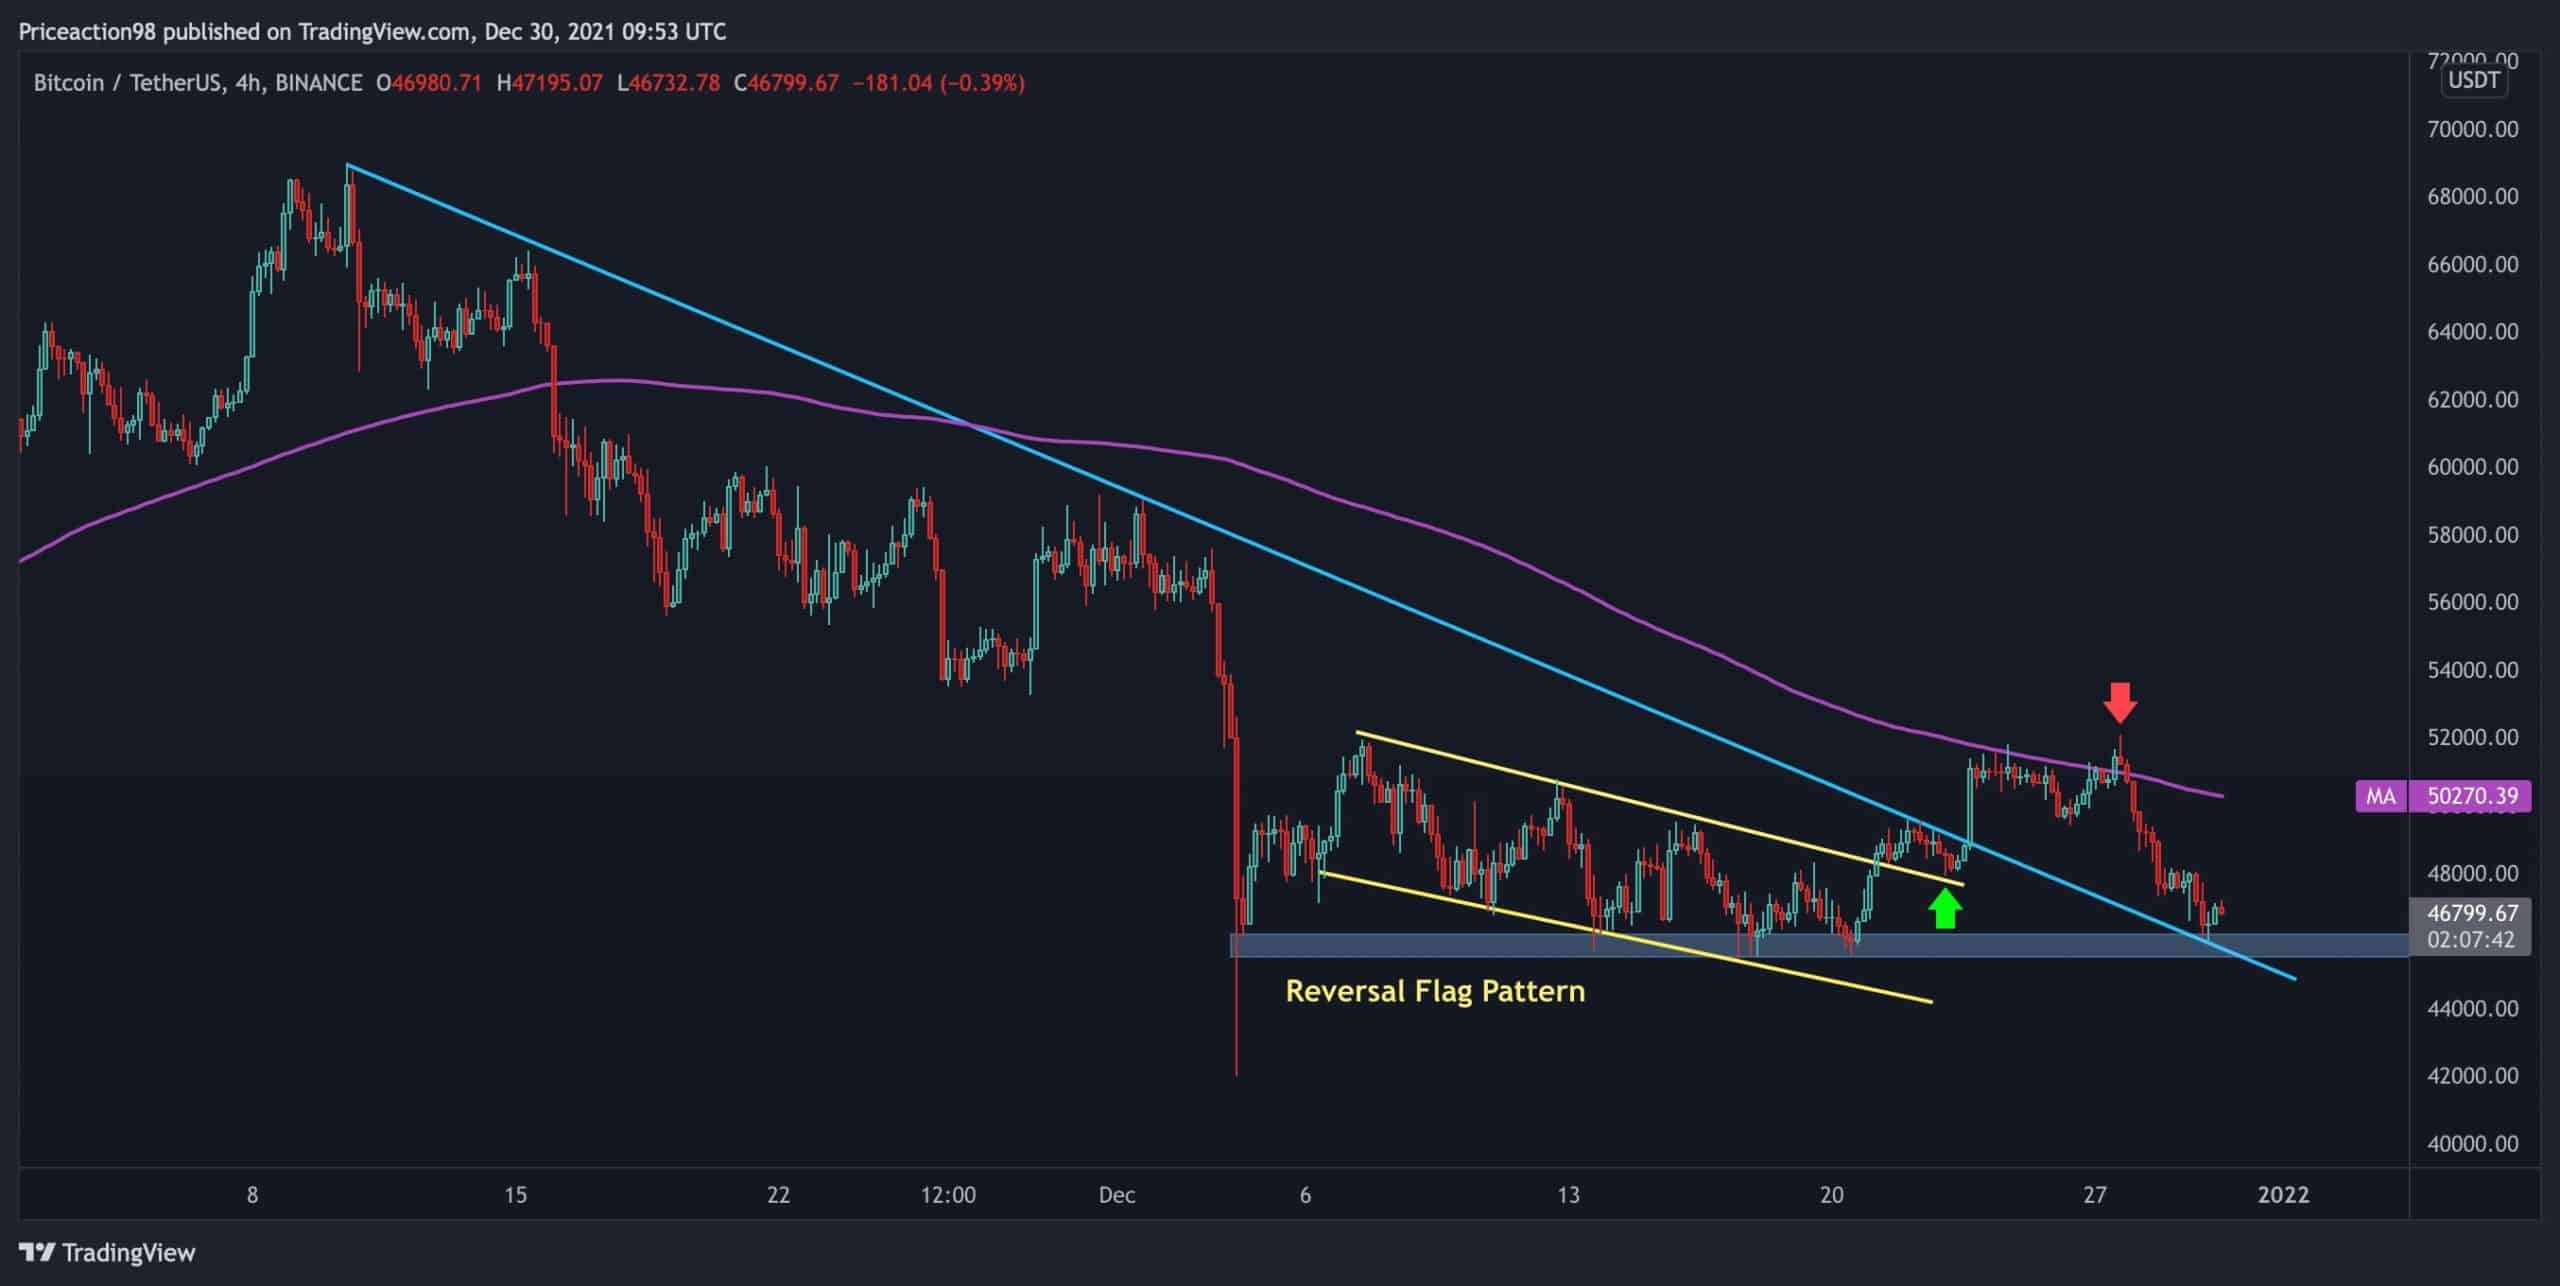
The 4-Hour
After the recent shakeout, bitcoin formed a reversal flag pattern (yellow trendlines) and broke it from the top, then a nice pullback to the upper trendline – and a breakout was confirmed.
However, the price was also rejected by the 200-MA line, and it appears to have started another decline. Currently, price is struggling against two major support areas – the blue trendline and the $ 45-46,000 level.