
Ethereum price shows a bullish future after its breakout from the symmetrical triangle. Although optimistic, ETH needs to overcome a few hurdles before reaching to significant levels.
Ether price
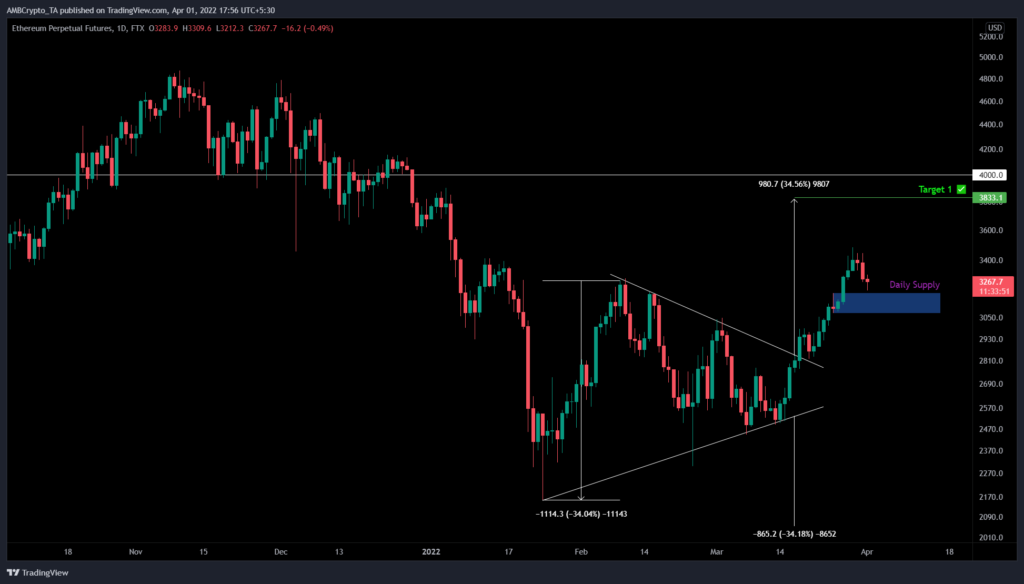
Ethereum’s price action between January 24 and March 27 led to the formation of a symmetrical triangle pattern. This technical pattern consists of three lower highs and four upper lows which are connected using trend lines.
Theoretical forecasting methods suggest this technical pattern could lead to a 34% move, obtained by measuring the distance between the initial swing points of the triangle. Adding this distance to the breakout point at $2,837 reveals the target as $3,818.
On March 27, ETH produced a daily candlestick above $2,837, indicating a breakout. Since then, the smart contract token has surged 22% but faces bull exhaustion. As a result, ETH has fallen by 7% and is currently approaching the $3,077-$3,197 demand zone. A bounce off this barrier will likely trigger another advance, but this time ETH will retest the 200-day simple moving average (SMA) at $3,489.
Since this hurdle is formidable, a successful flip could be the key to catalyzing a bull run to $3,833, the symmetrical triangle’s predicted target. In a highly bullish case, this move could tag the $4,000 psychological barrier, bringing the total run-up to 25%.
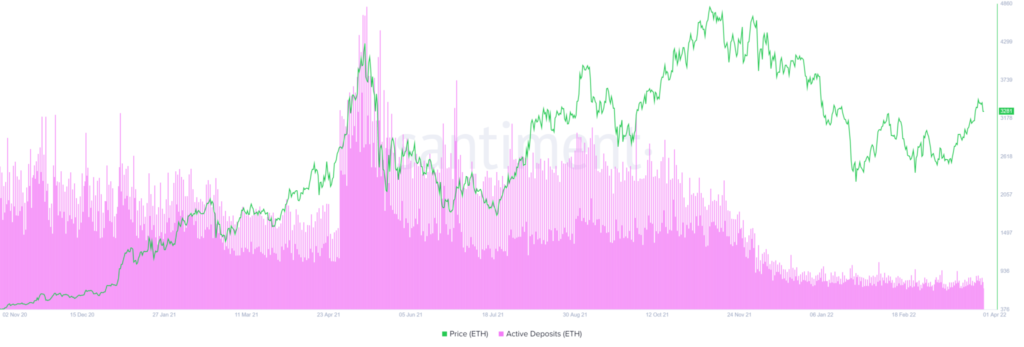
The active deposits metric is an on-chain indicator that tracks the number of deposits to exchange wallets. A rise in this index is bearish for the underlying asset as it signals investors’ interest in selling their holdings.
For Ethereum, this on-chain indicator has been on a downtrend since November 2021 and has deteriorated from 22,800 active deposits to 205 as of this writing. This 95%+ decline in deposits indicates that ETH holders are optimistic about Ethereum price performance in the near future and are comfortable holding their tokens in cold wallets.
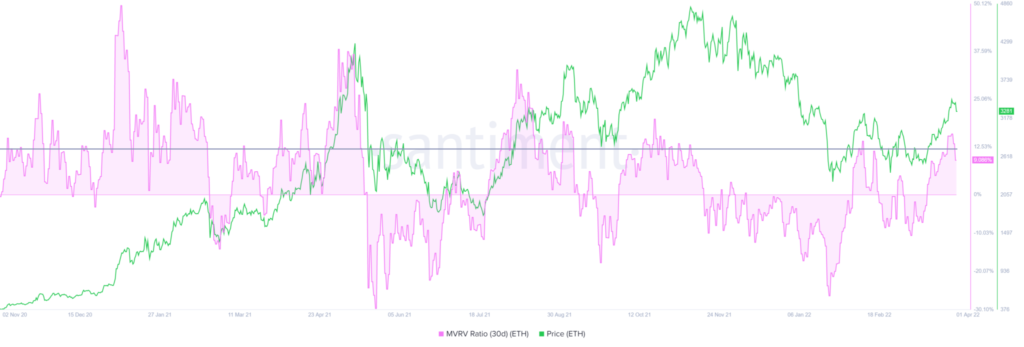
The 30-day Market Value to Realized Value (MVRV) pattern adds even more credence to the uptrend around Ethereum’s price. This indicator is used to gauge the average profit/loss of investors who have purchased ETH tokens over the past month.
A negative value below -10% indicates that short-term holders are at a loss and is typically where long-term holders tend to accumulate. Therefore, a value below -10% is often referred to as an “opportunity zone.”
Given that MVRV is hovering around a local high at around 10%, a minor retracement seems likely as short-term holders panic. Interestingly, this pullback can be called a bullish retracement due to the presence of the daily demand zone, ranging from $3,077 to $3,197.
All in all, Ethereum price shows a bullish outlook and is backed by on-chain indicators, suggesting that a move to $4,000 is inevitable.