Ethereum price has been hovering inside a trading range since the sell-off in January. The recent downswing caused around the FOMC meeting on 4 and 5 May seems to have triggered a massive sell-off that could breach the formed range.
Investors should pay close attention to ETH as the incoming dip could offer a good chance to buy the dip.
Ethereum price readies for more descent
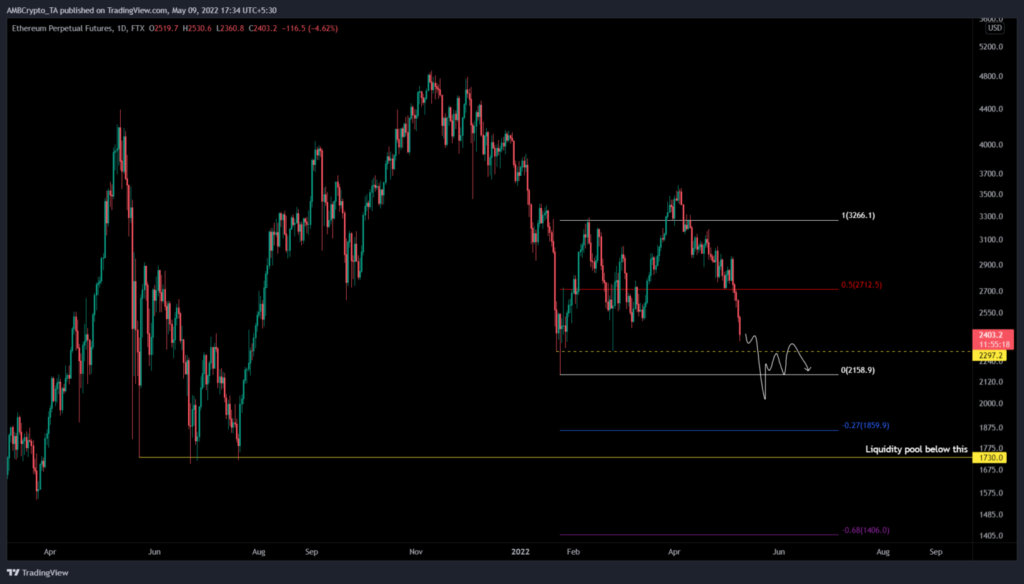
Ethereum price crashed 33% between 18 and 24 January and set a swing low at $2,158. This downswing was met by many investors who rushed to buy the dips. As a result, ETH rallied 51% in the next two weeks or so to set a swing high at $3,266. This move, set a range that is still in play.
More often than not, ranges are easy to spot and trade. As mentioned in previous articles, the asset usually sweeps one of the range boundaries and heads in the opposite direction to do the same. For Ethereum price, the 51% rise was followed by a pullback below the 50% retracement level at $2,712. The rally that appeared at the end of this correction pushed ETH up 55% to sweep the upper range.
The failure to maintain the momentum on this upswing led to a steep reversal that pushed ETH back inside the range. Although there was a minor bounce around $2,712, the buyers were overwhelmed by sellers after the flip of this foothold into a resistance barrier on 6 May, which was around the time of the FOMC.
Selling pressure has built up, causing a sharp decline to $2,360, where Ethereum price is currently trading. As this decline continues, ETH is likely to retest the support floor of $2,297, which is likely to provide a brief spike in buying pressure.
Investors need to be prepared for a breakdown of this barrier and a sweep of the range low at $2,158. A quick move below this level could be followed by a recovery above this level. However, in dire cases, Ethereum price might retest the -0.27% retracement level at $1,859. The most perfect place to buy the dip would be the $1,730, below which is the sell-stop liquidity formed in May and July 2021.
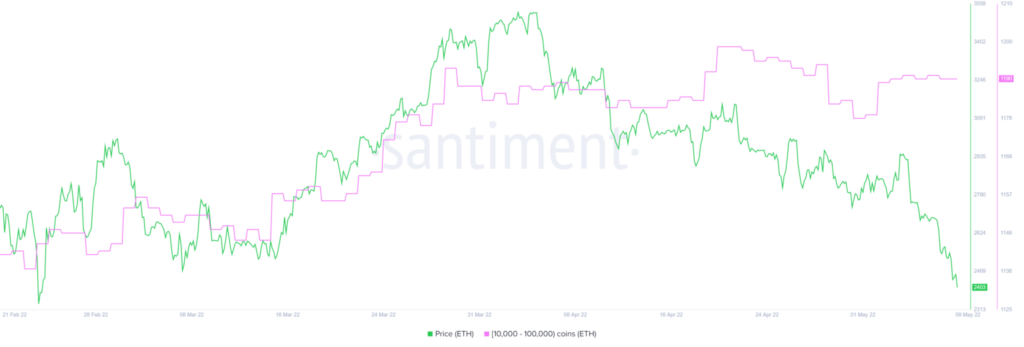
The supply distribution chart adds credence to the buy dip thesis, which shows that ETH wallets holding between 10,000 and 100,000 ETH fell from 1187 on May 9 to 1187 on May 9, indicating that these holders add more to their bags.
This development suggests that these high net-worth investors or institutions are bullish on Ethereum price.