Bitcoin (BTC) has bounced at a Fib support level after breaking down from a short-term structure. The direction of the trend is still unclear.
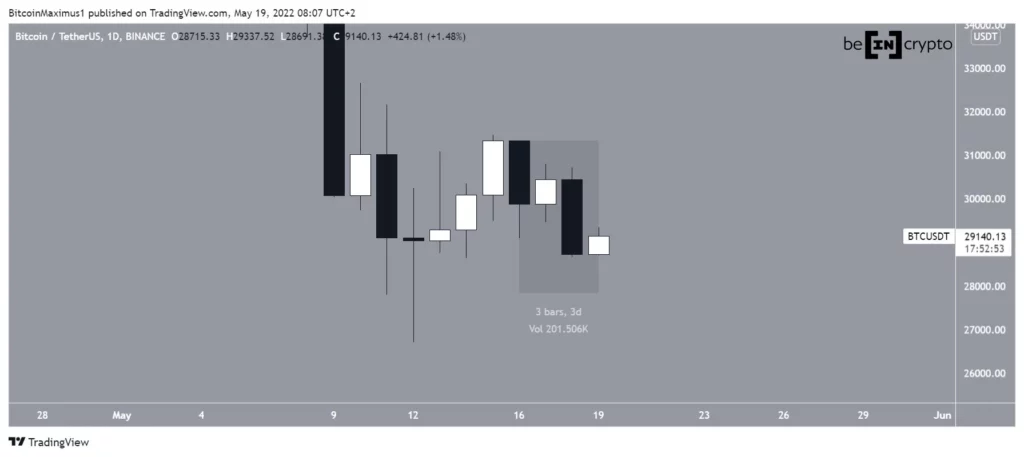
BTC fell significantly on May 18, creating an engulfing bearish candlestick. The price reached a daily close of $28,715, which is the lowest since December 2020.
While there is no horizontal support below the current price, there is slight wick support until $27,000, created by the long lower wicks of May 11 and 12.
Short-term breakdown of BTC
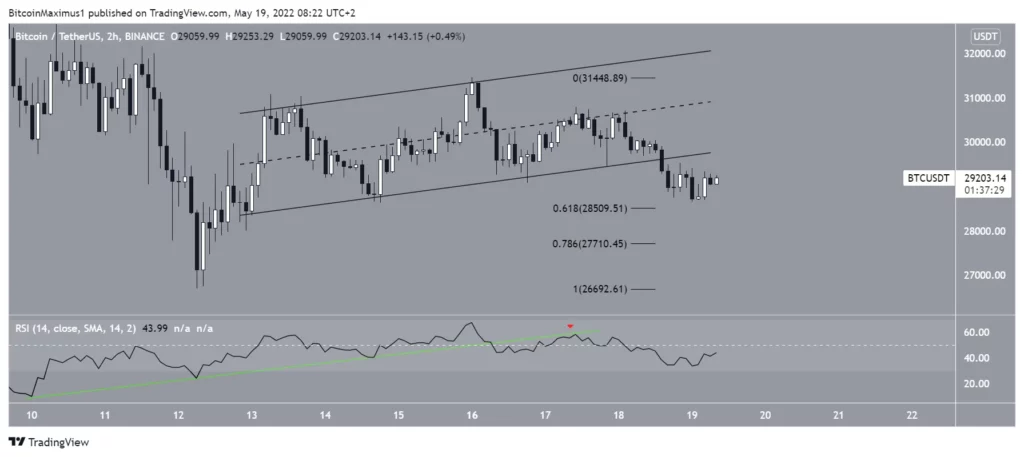
The two-hour chart shows that the price had been trading in an ascending parallel channel since May 13. The price finally fell from the channel on May 18th.
The breakdown from the channel was preceded by an RSI breakdown (green line) and a decrease below 50 (red icon). Such RSI movements usually precede a similar decrease in price and increase its significance.
Currently, bitcoin has bounced off the 0.5 Fib retracement support level at $28,500. The next closest support zone is at $27,700.
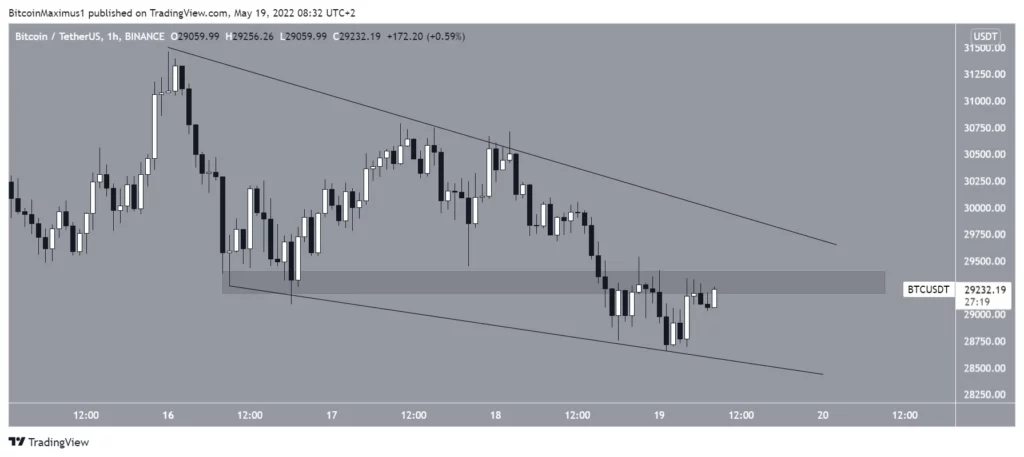
Despite the breakdown, an even closer look at the movement shows that the price could be trading inside a descending wedge, which is considered a bullish pattern.
However, it is also facing resistance from the previous support zone at $29,300. As a result, bitcoin must break through this level in order to potentially start rising.
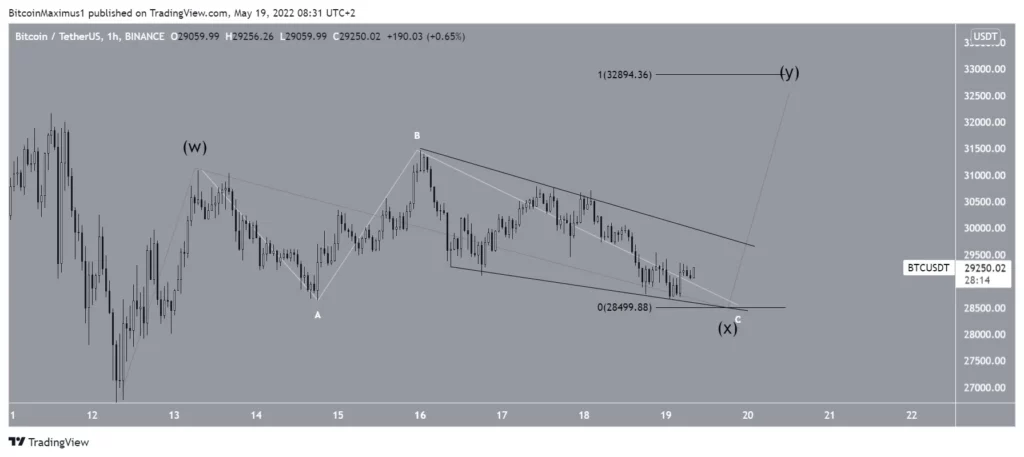
Wave count analysis
If the price is trading inside a descending wedge, it could be possible that bitcoin is in the process of completing an ending diagonal, as outlined by the C wave (white).
If so, the price would break out and potentially reach a high of $32,900 (black), before another descent.