Bitcoin (BTC) has been falling at an accelerated rate since June 7, creating seven bearish daily candlesticks in the process.
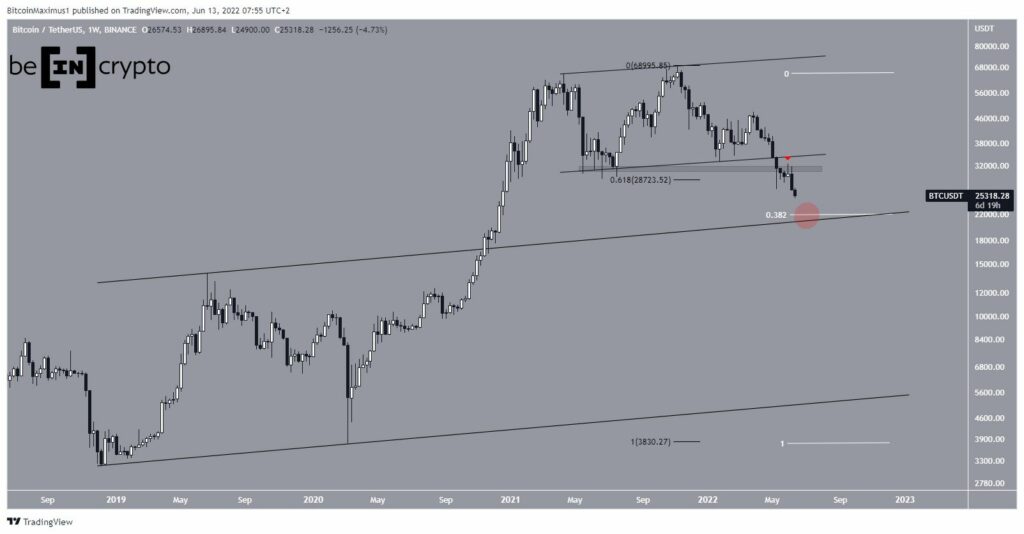
BTC has been falling since hitting an all-time high of $68,995 last November. In May, it broke out of a long-term ascending parallel channel, confirming that the trend is bearish.
Initially, the price bounced at the 0.618 Fib retracement support level, but was rejected by the $30,000 horizontal area (red icon), validating it as resistance.
If the downward move continues, the next support zone is at $22,000. This is the 0.382 Fib retracement level when using a logarithmic Fib tool and the resistance line of a previous ascending parallel channel (red circle).
As a result of these confluences, it is likely to provide support.
Short term failure
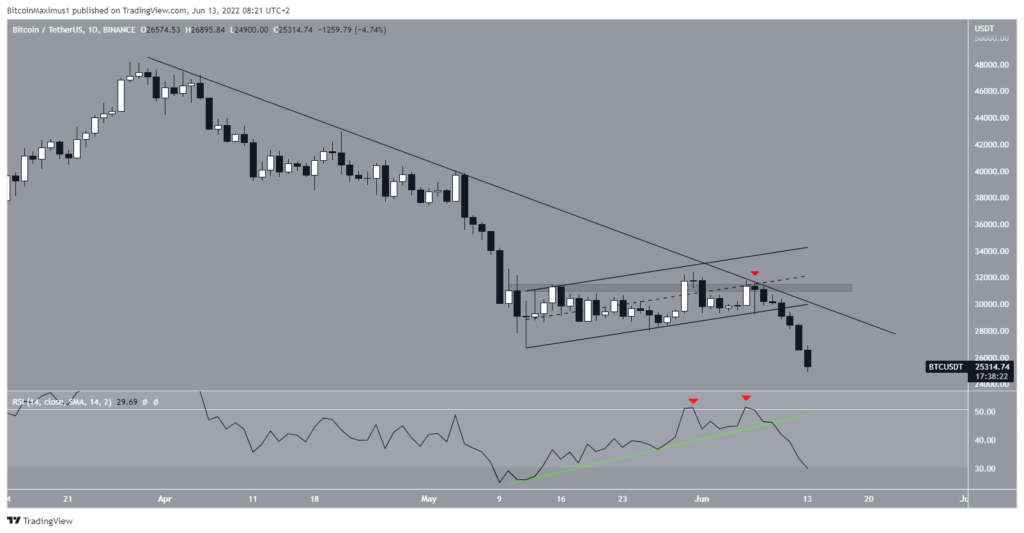
The daily chart shows that BTC has been rising in an ascending parallel channel since May 12. While trading it, it hit a high of $31,589 on June 7.
Once there, it was rejected by a confluence of resistance levels, more specifically the $31,500 horizontal area, the middle of the aforementioned channel and a descending resistance line in place since April.
Additionally, the daily RSI had generated a bullish divergence (green line) from the May 12 low. The breakout of the channel coincided with a breakout of this trendline, another sign that the trend is down.
BTC Wavenumber Analysis
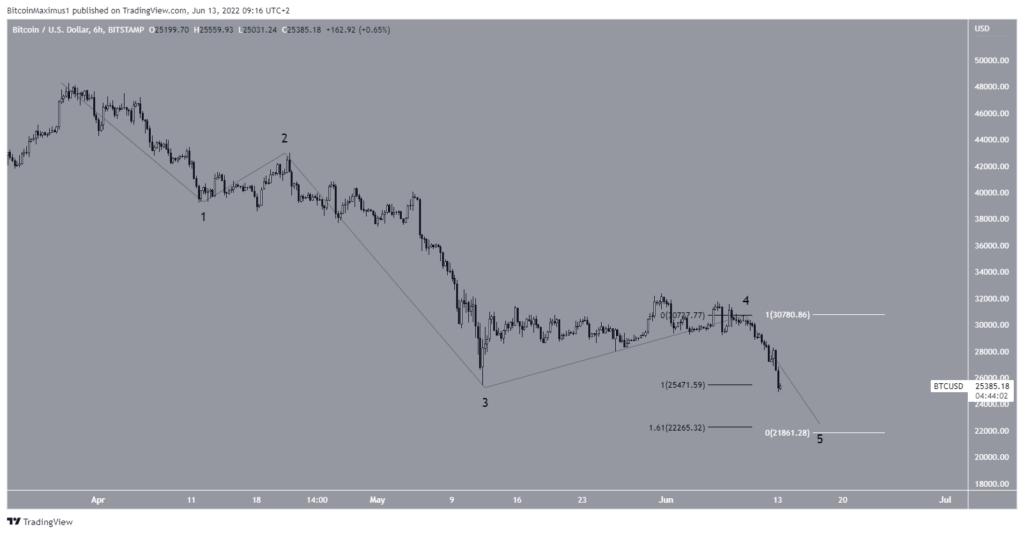
The wave count suggests that BTC is in the C wave of an A-B-C corrective structure (red). The sub-wave count is given in black, suggesting that the price is in the fifth and final sub-wave.
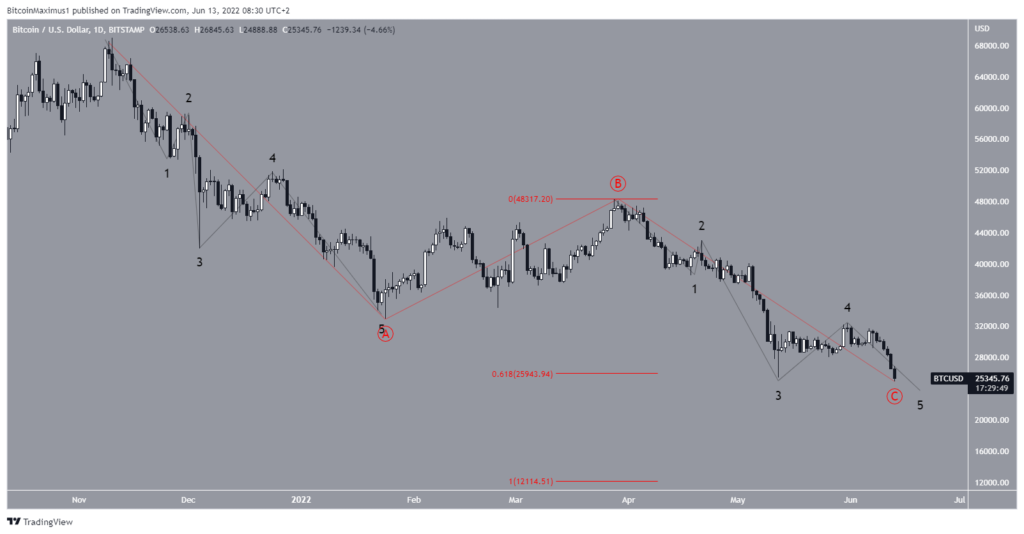
The short-term count provides a target near $22,000, found using the length of subwave one (white) and an outer retracement on subwave four (black). This is also in line with the weekly period readings.
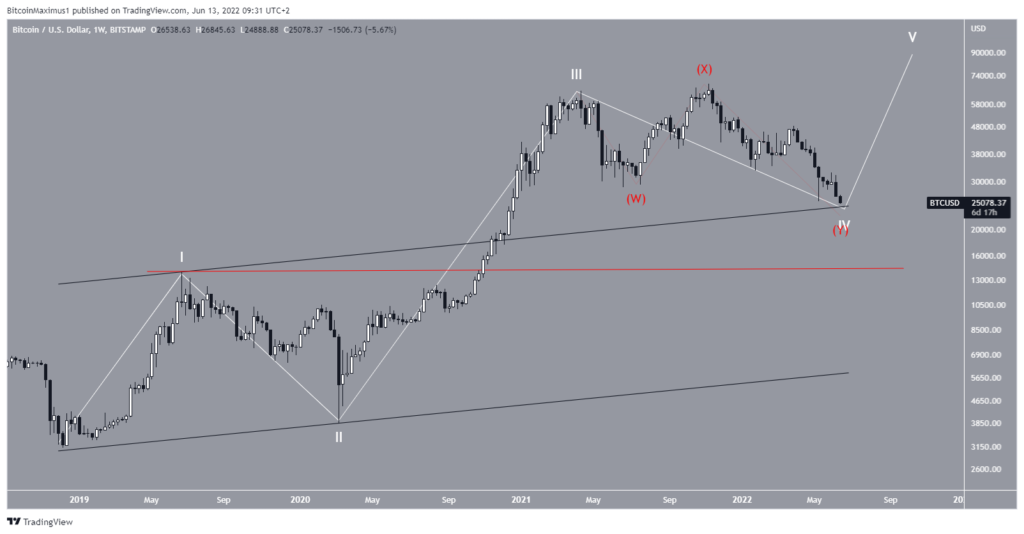
As for the long-term count, it is likely that the price is nearing the bottom of wave four (white) of a long-term upward movement that began in Dec 2018.
So, once the current decline is over, another move towards a new all-time high could still occur.
A decrease below the wave one high (red line) at $13,880 would invalidate this potential wave count.