
Over the past week, Ethereum [ETH] entered a sideways track after breaking out of its bullish setup in the daily timeframe. Post recovering from the bearish flag breakdown, the bulls found renewed buying pressure and reclaimed their spot above the 20/50 EMA.
After tipping trendline resistance towards support, the buyers affirmed their strength while breaking through the 23.6% and 38.2% Fibonacci resistances.
A potential rebound from the near-term EMAs would position the alt to continue its uptrend in the coming sessions. At press time, the alt was trading at $1,527.7, down by 4.92% in the last 24 hours.
ETH Daily Chart
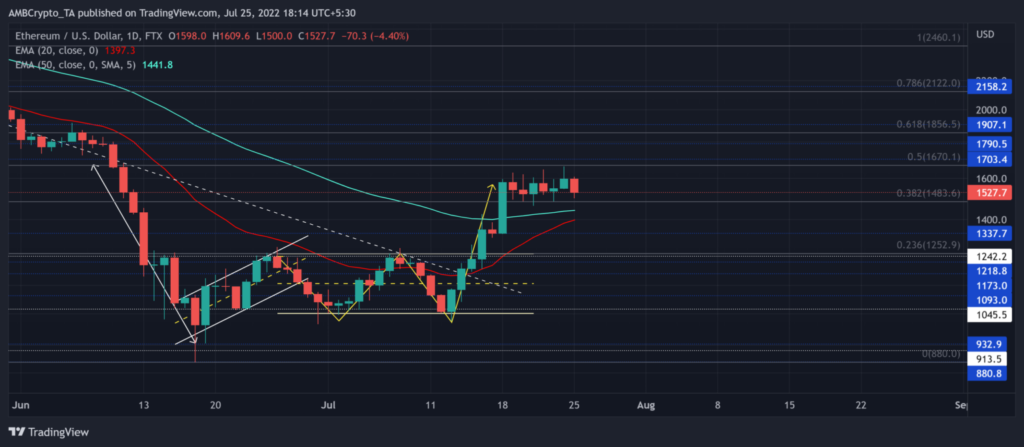
ETH’s long-term trendline resistance finally cracked after a recent return to buying. Meanwhile, the 20 EMA (red) looked north to show a strong buying market.
The coin saw an over 50% ROI from the 13 July low and slammed into the 50% Fibonacci resistance. Since then, the king alt has been consolidating in the $1,500-$1,600 range.
The double bottom structure has reignited the underlying buying pressure lurking in the market. Any bullish crossover on the 20/50 EMA would help buyers amplify their buying spree. In this case, potential targets would be near the 61.8% Fibonacci resistance at the $1,850 area.
Should the buyers dwindle, any close below the 20/50 EMA could cause a throwback toward the $1300-mark before a likely revival.
Rationale
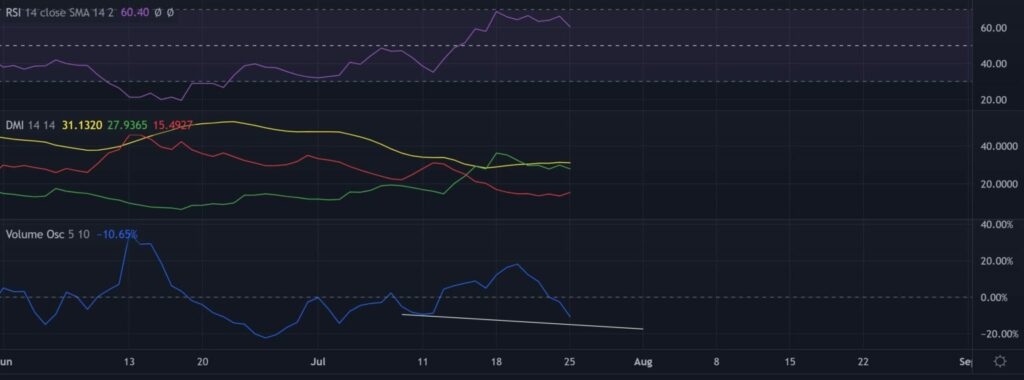
The Relative Strength Index maintained its position above the midline to reflect a buying advantage. Traders/investors should watch for a rally towards or below equilibrium to identify the chances of a bullish invalidation.
Also, the DMI lines continued to exhibit a strong selling advantage with a strong directional trend for ETH. Although the trading volumes have taken a plunge, any recovery on the Volume Oscillator could see an uptick in volumes.
Conclusion
Given the breakout of the double bottom above the short-term EMAs alongside the bullish edge in technicals, ETH could see continued recovery. Potential buy/sell targets would remain the same as described above.
Finally, investors/traders need to watch out for Bitcoin’s movement. This is because ETH shares a staggering 94% 30-day correlation with the king coin.
Top of Form