
This week might be interesting for Bitcoin to watch its price levels as the upcoming FOMC meeting will play a vital role in driving its price further.
Over the past few days, bitcoin registered a significant spike as the US stock market edged higher with a 3.4% gain and the S&P 500 index rose to its highest level in 44 days.
However, Bitcoin is poised to witness a bearish momentum soon after forming another top in the price chart.
BTC price down is just around the corner!
This week will act as a key factor in determining the further price action of BTC, as several macroeconomic events will play a significant role in the price movement of Bitcoin.
A popular crypto analyst, Cryptocapo, predicts that Bitcoin may start a fresh downward rally after forming a triple top in the price chart.
Last week, Bitcoin formed a double top at $21.1K and faced rejection. According to the analyst, Bitcoin may again make a top at $21.2K and create a triple top pattern in the price chart before witnessing a sharp fall.
Bitcoin is expected to reach $21.2K by next week and may face rejection and start a sharp decline. Cryptocapo predicts that bitcoin could touch a low of $20K if it fails to trade above the expected price level.
The analyst gives an ultimate bearish confirmation for BTC if it makes an upward retracement above $19.8K and makes a bearish candle at $20K.
This price movement could take bitcoin to new lows as BTC could trade below $14K by the end of November.
To the above analysis, several crypto strategists have responded positively as they predict the exact price movement for Bitcoin.
Another cryptocurrency analyst, Tony Ghinia, predicted that bitcoin could rise to a maximum price range of $22K to $24K before falling as low as $11K to $14K by the end of 2022. However, BTC may start a new bullish rally to $30K in Q1 2023.
Can BTC Spark A Short-Term Surge?
BTC has been struggling to continue the bullish rally it initiated in October as it trades in a consolidated range near $20K.
BTC price declined after it failed to break above the $21.1K price level last week. According to CoinMarketCap, Bitcoin is currently trading at $20.4K, showing a slight increase of 0.26%.
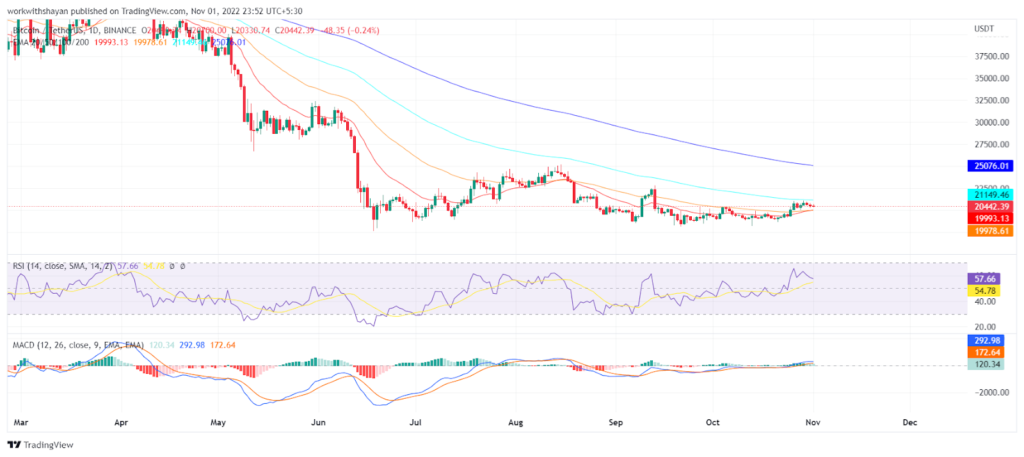
Looking at the daily price chart, the 100-day EMA is acting as an obstacle as it trades at $21.1K, which pushed Bitcoin to the downside. The RSI indicator also dropped from a level of 62 to 57, hinting at a high probability of a bearish trend.
The lower boundary of the Bollinger Bands is $19.9K, which is an immediate support level where the EMA-20 is trading. If BTC breaks below this support, it could go as low as $19.3K.
However, the MACD line brings some promises as it continues to trade in a positive territory. The Bollinger band’s upper limit is $21.6K, above which Bitcoin may aim for the EMA-200 price level at $25K. To initiate a short-term bullish momentum, BTC needs to trade above its 23.6% Fib retracement and hold its trend.