Bitcoin (BTC) is moving in a sharp upward rally on the path to a new all-time high price. While a short-term decline could occur, BTC should gradually move towards a new high.
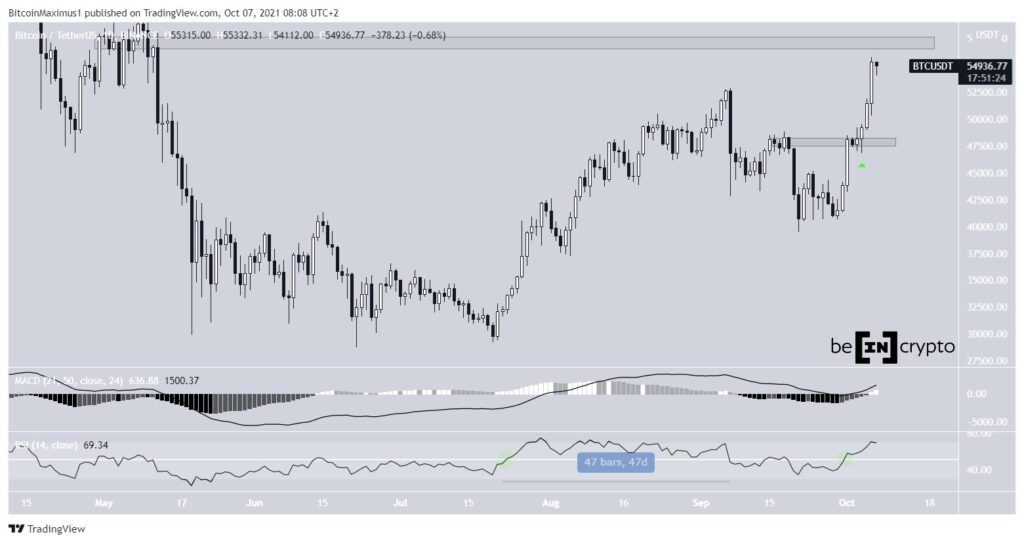
Bitcoin increased considerably on Oct 6, creating a large bullish candlestick with a magnitude of more than $5,000. This took it above September highs of $ 52,920 and a local high of $ 55,750. BTC is now approaching the $57,200 resistance area.
Technical indicators are bullish as the RSI and MACD provide bullish readings.
The RSI is increasing after moving above 50 (green circle) on Oct 1. The previous time, it had done so on July 21, resulting in a 47-day bullish move. The current increase also coincided with a retest of the $47,800 area (green icon), which is now expected to act as support.
MACD, which is created by short and long term moving averages (MA), is also rising and is in positive territory. This means that the short-term MA is above the long-term MA. In addition, its positive histogram means that the short-term AD is changing faster than the long-term average.
Therefore, the daily time frame for BTC provides a firmly bullish outlook.
Future movement
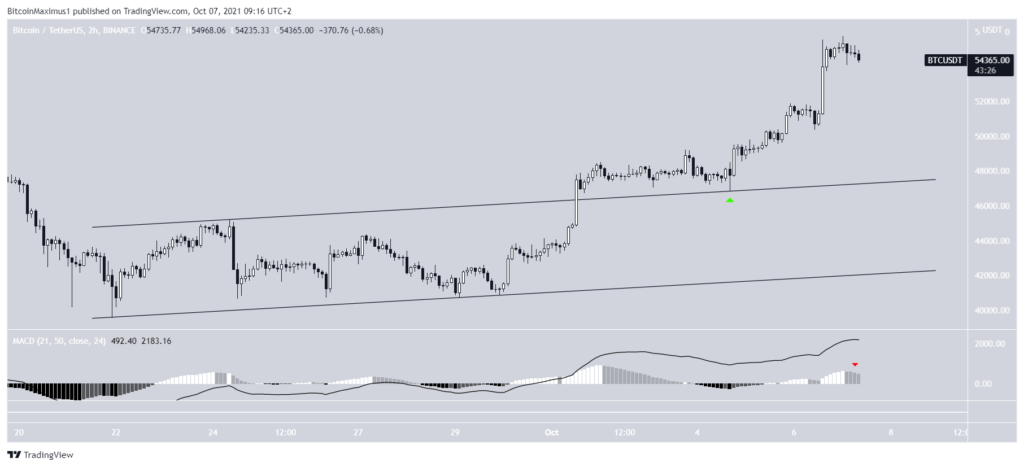
The two hour chart also gives a bullish outlook. BTC has broken out from a parallel ascending channel and validated it as support after (green icon).
Since channels usually contain corrective movements, this is a sign that the movement is not corrective.
Rather, it appears to be an impulsive upward move, meaning that the increase is part of a bullish trend rather than just a bounce.
Number of Bitcoin waves
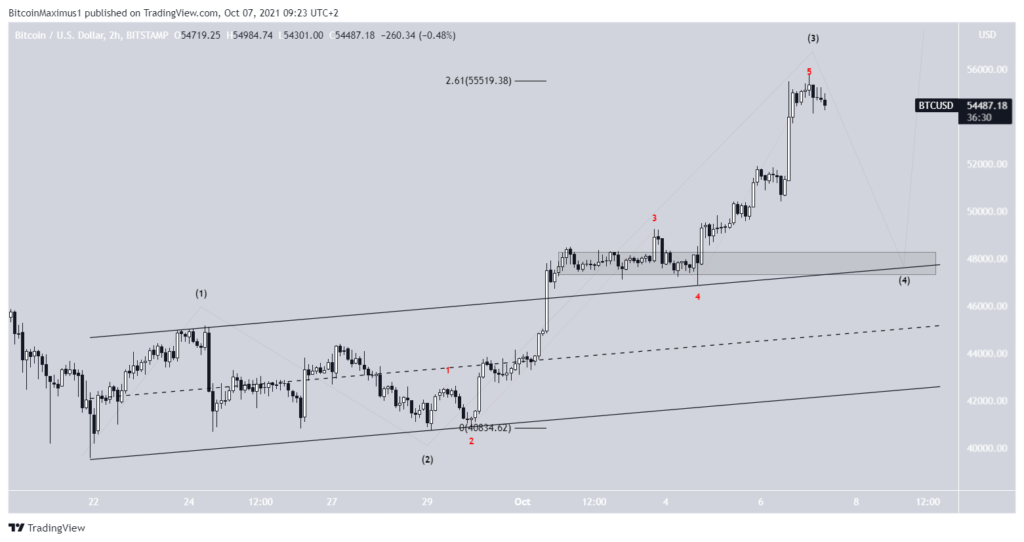
Because the channel breakout indicates that the current movement is impulsive, the wave count suggests that the current increase is part of wave three (black). Wave three is the most likely to extend, hence the rapid upward move. So far, wave three has been 2.61 times as long as wave one.
It is possible that a steep decline will follow soon as part of wave four, completing a pullback in wave four. This is an Elliott wave occurrence where a sharp drop follows a sharp increase, before the continuation of the upward movement.
If that happens, the $ 48,000 area would be very likely to trigger a rebound.
This level is:
- A horizontal support area
- The resistance line of the channel
- Wave four of a smaller degree
Therefore, if BTC hits this support level, it is likely to end the downside.
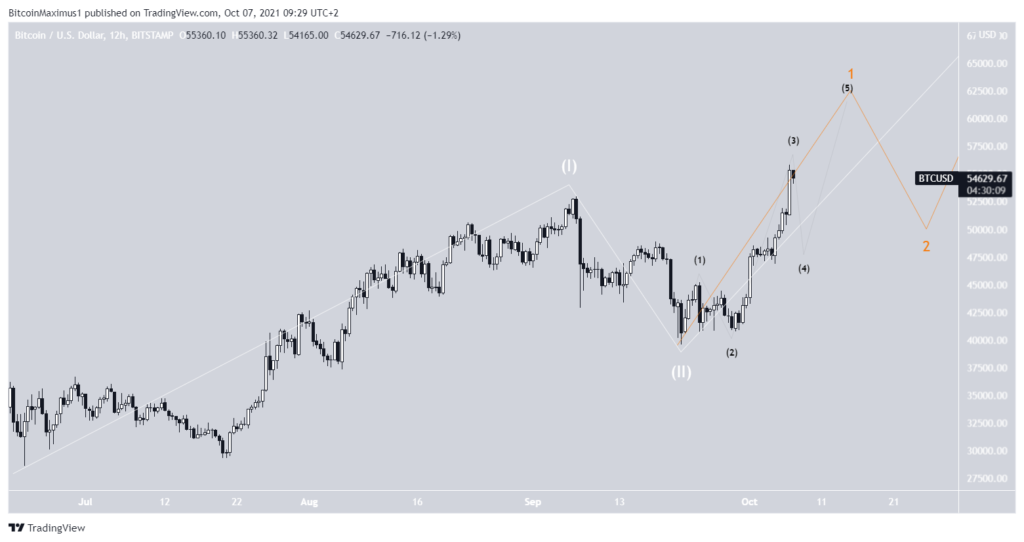
The long-term wave count is also bullish, suggesting that BTC will move toward a new all-time high.
The most likely possibility is that BTC is in a 1-2 / 1-2 wave formation. This means that it is currently in the first part (orange) of an increase that will eventually get even sharper, leading it to a new all-time high price in the process.