The past few hours have seen a massive sell-off, causing Bitcoin price to unexpectedly and hugely drop below $40,000. The on-chain data shows an absolute capitulation phase in the market, which was intensified by long-term holders just before the crash to $35,000.
Long Term Analysis: The Daily Chart
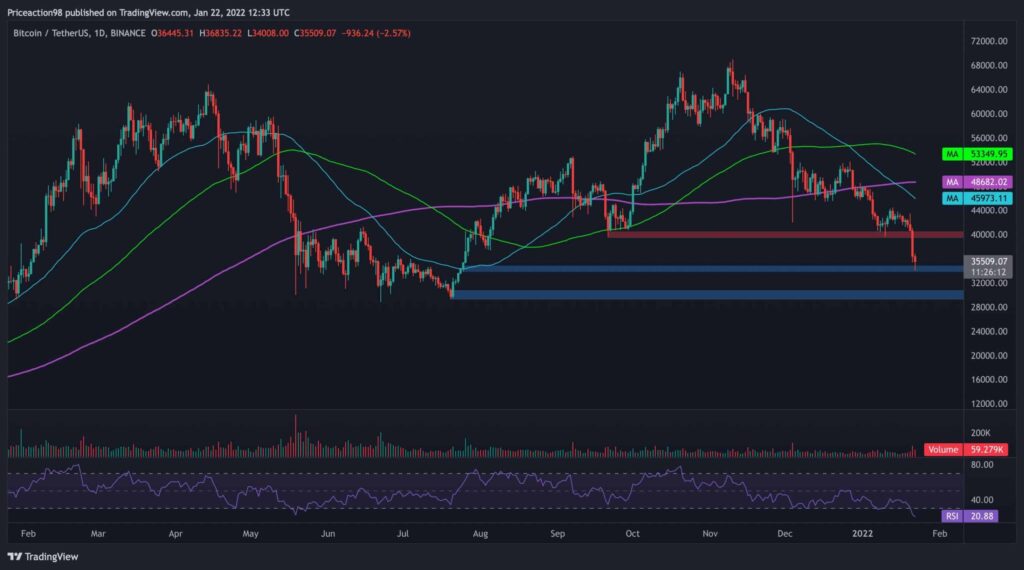
Yesterday, Bitcoin lost a critical support range at $37K – $40K. As shown in the chart below, before the price decline beneath $40K, both 50-DMA and 100-DMA lines have crossed the 200-DMA to the downside, indicating further bearish momentum incoming.
Possible support levels are the current price zone at $35,000 followed by $30,000 (May-July 2021 low). On the other hand, the former support zone ($40,000) had turned into a significant resistance if the price made a pullback from either of the two mentioned support zones. The daily RSI also points to massive overselling, currently sitting at the 20% mark, suggesting that a bullish pullback is possible in the near term.
Short Term Analysis: The 4-Hour Chart
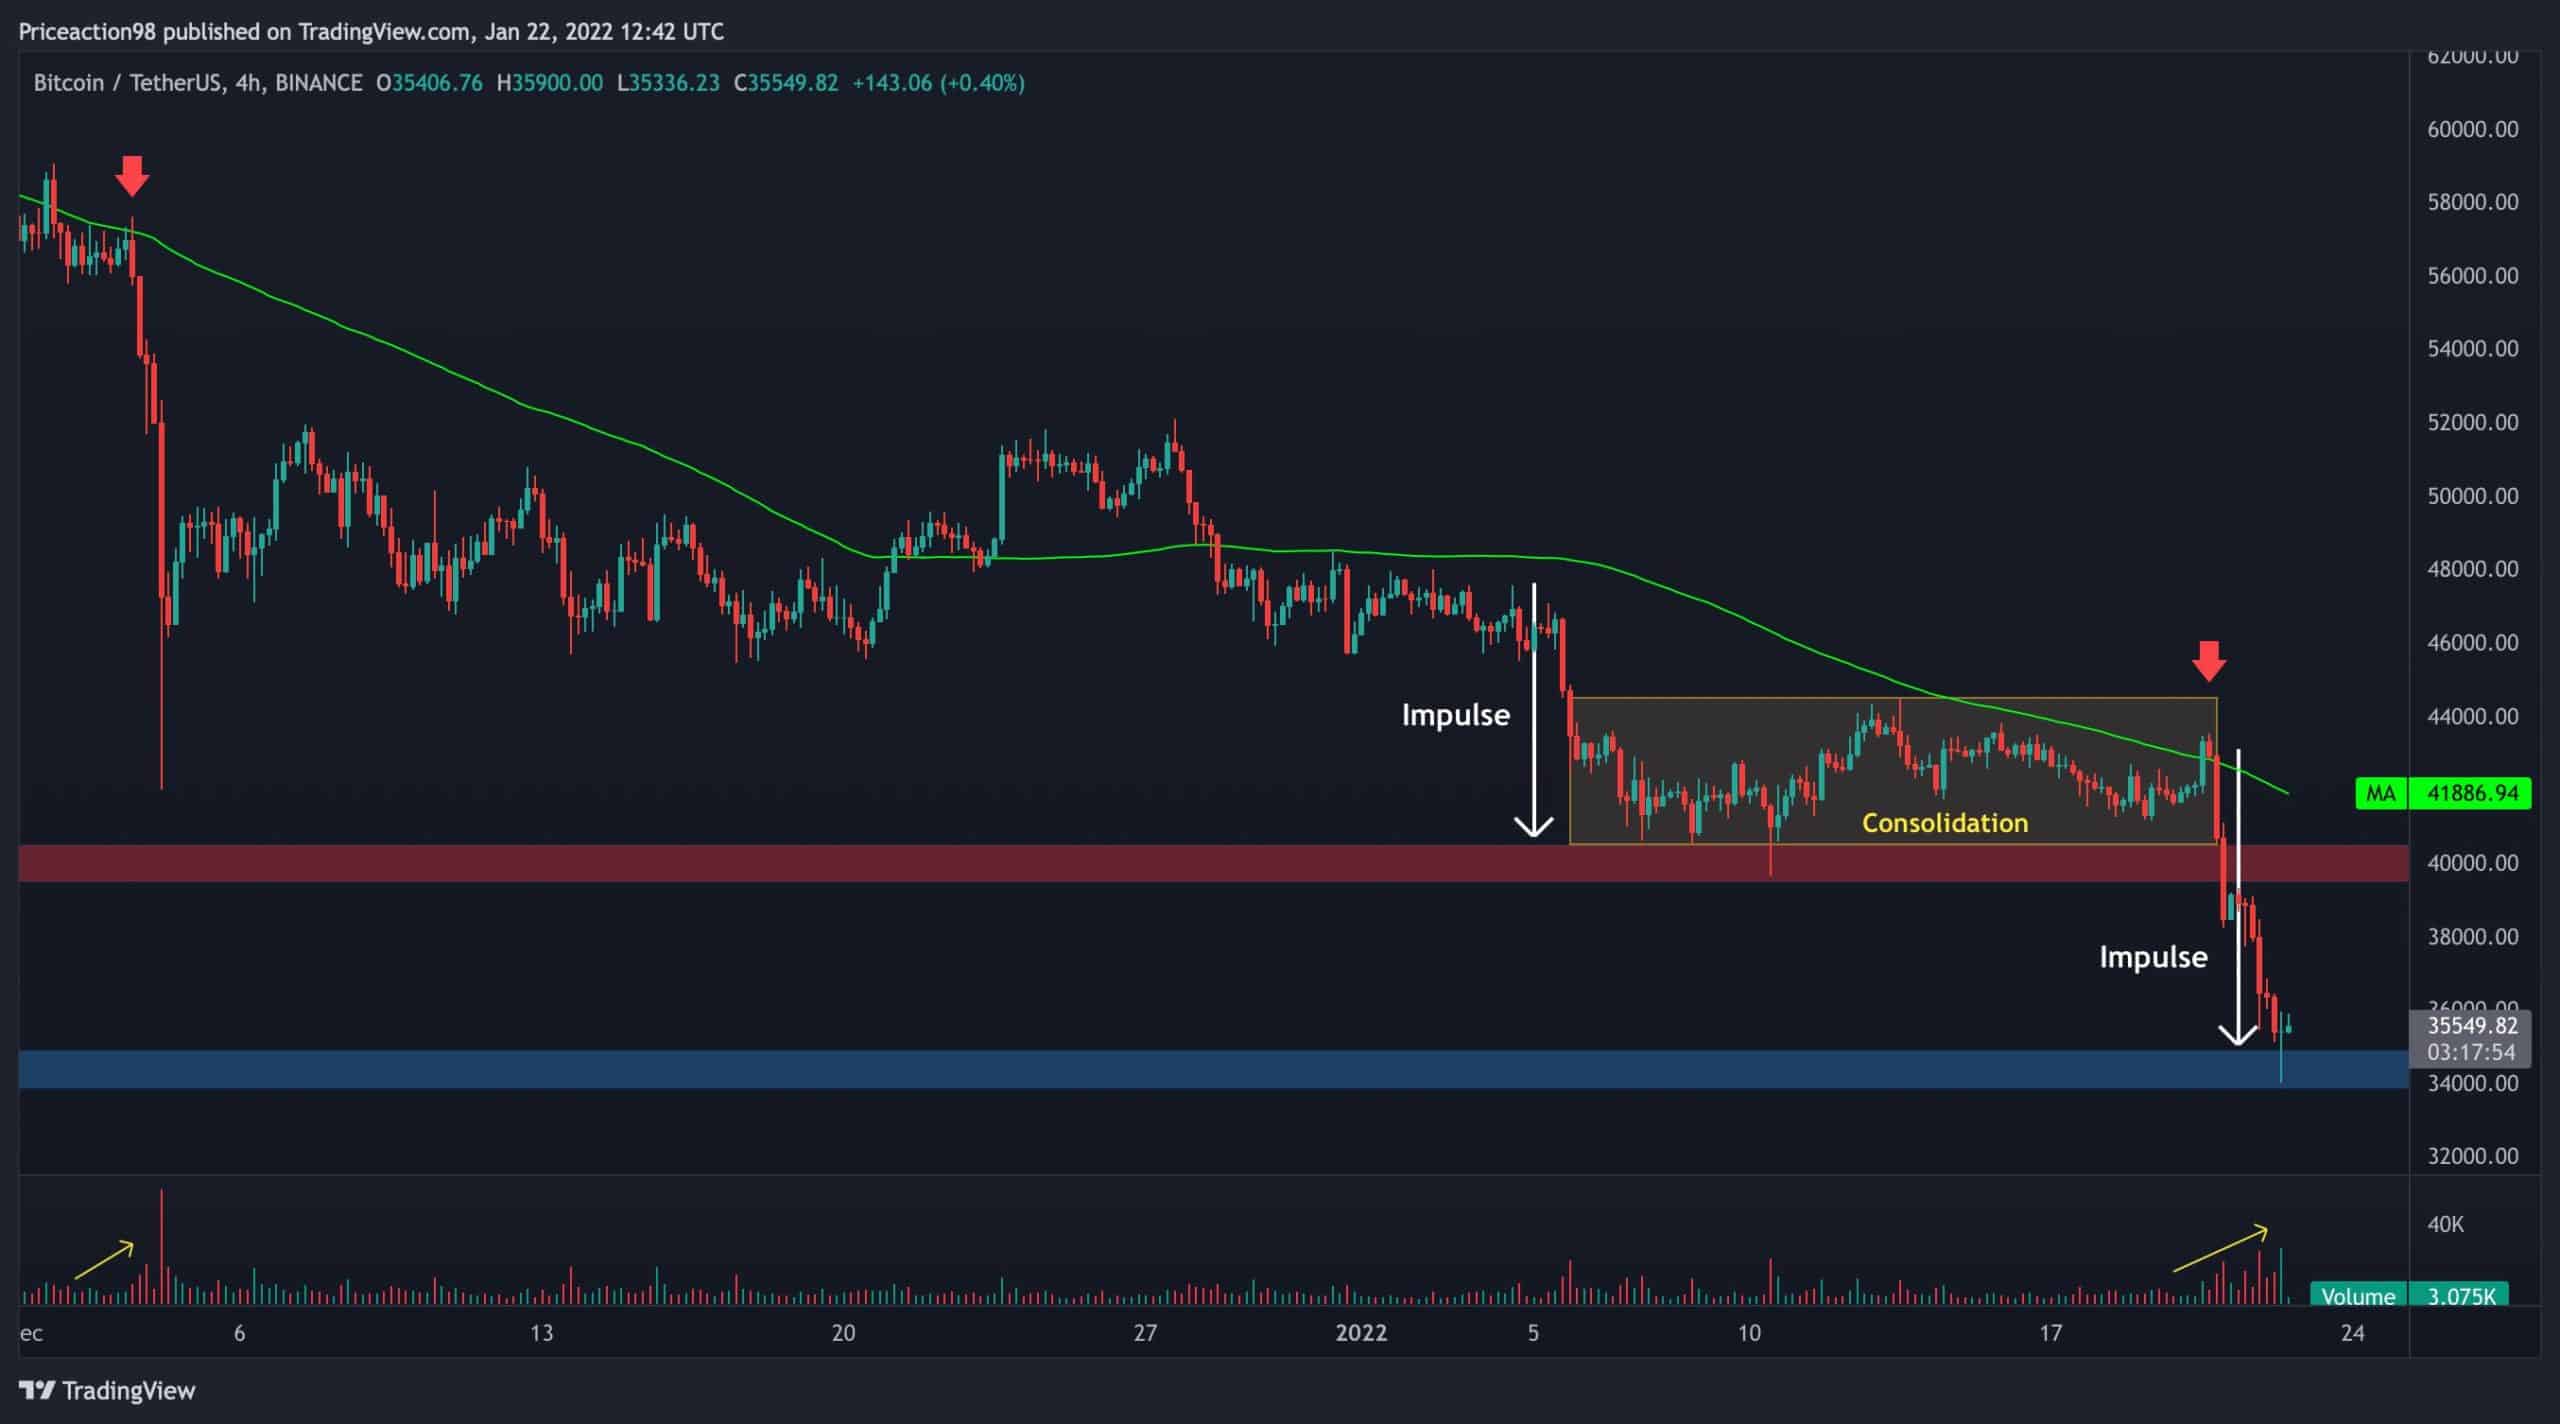
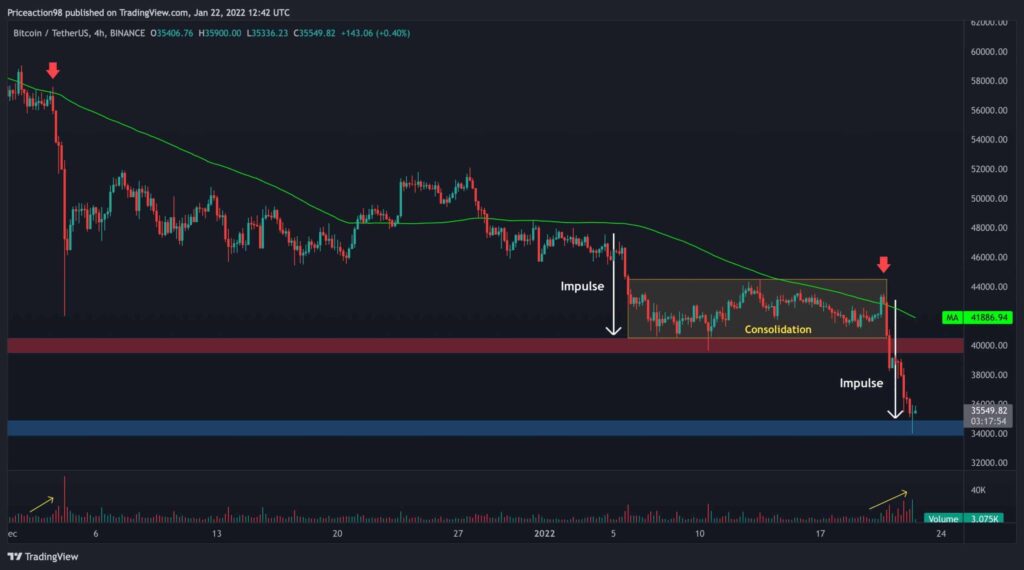
Evaluating the last week’s price action on the 4-hour timeframe, it is evident that the price was under a heavy downtrend and got rejected at the 100-MA several times.
This time was no different, as the price impulsively plummeted from $48,000 to $40,000, went through a consolidation phase, and once again got rejected at the 100-MA. This rejection triggered the next bearish leg down.
With the considerable spike in trading volume and the last couple of candles around the $35k support, we can expect another phase of consolidation before the market decides its next direction.
On-chain analysis
The Spent Output Profit Ratio (SOPR) is a well-known on-chain metric that can map the “Surrender” phase in a bear market.
The short-term holders have been selling or moving their coins after Bitcoin registered the recent November ATH at $69K. During the recent bloody days, short-term holders were panic-selling and realizing their losses. As you can see, the STH_SOPR metric has dropped to 0.95 during the last shakeout, which is a perfect explanation for the “Capitulation” event.
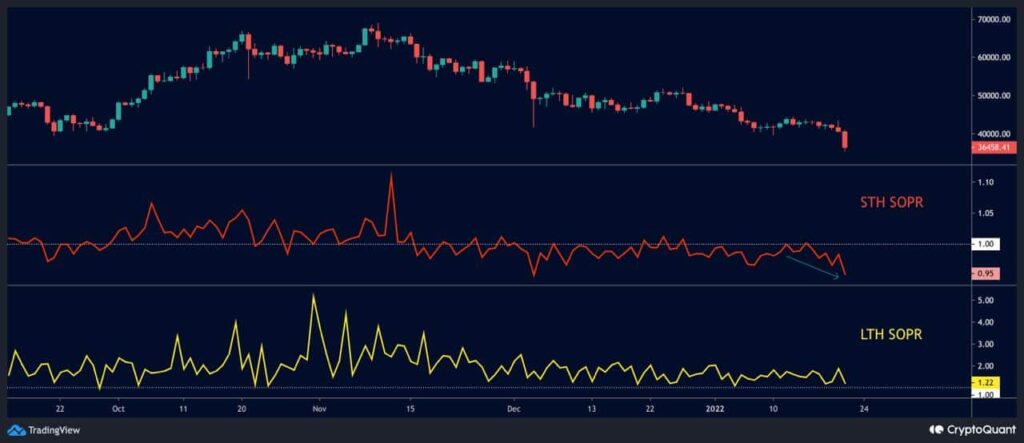
An interesting piece of data that completes the puzzle was the sudden spike in LTH-SOPR before the recent price drop. This means that some long-term holders may have tried to exit the market before the crash, and in doing so, they intensified the negative momentum in the market.


