
From its ATH, the king alt has been on a steep downtrend over the last four months. The descent saw a clash between the buyers and sellers at the $3,100-mark Point of Control (POC, red).
Assuming the altcoin sticks to its historical trends, ETH aims to test the $2,862 level before entering a possible phase of low volatility on its Bollinger Bands (BB). Short-term retracements may find support at the $2,500 mark before the alt continues to make higher lows.
At press time, ETH was trading at $2,736.6, up by 6.42% in the last 24 hours.
ETH Daily Chart
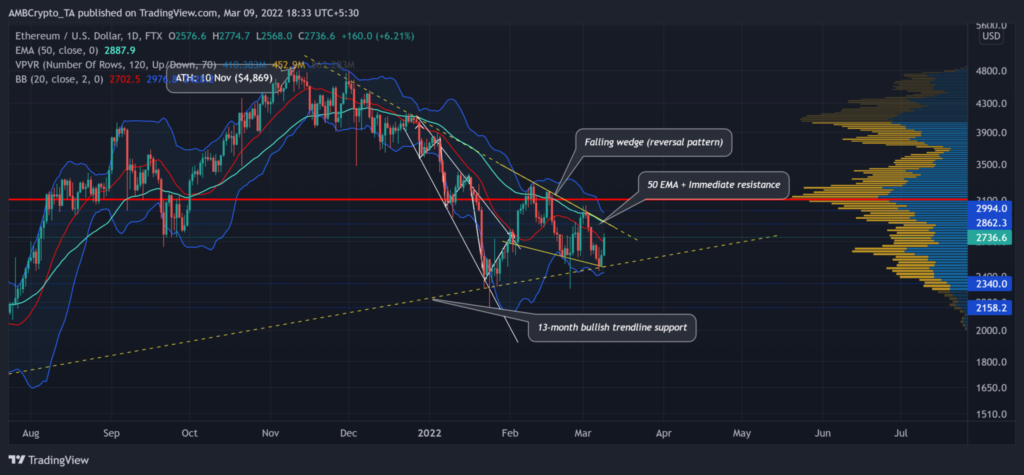
Since falling from its POC, the altcoin has seen several bearish engulfing candlesticks on boosted volumes that propelled ETH to its six-month low on Jan. 24. Additionally, the BB average (red) held as strong resistance throughout the fall.
Interestingly, ETH formed a descending broadening wedge (white) on a longer timeframe (one month). Historically, the alt saw a strong reversal from its 13-month bullish trendline support (yellow, dashed). This reversal rally then halted at the POC. Over the past month, ETH also formed a falling wedge (reversal pattern) on its daily chart.
Can the second largest crypto repeat its history? If so, a potential retest of the $3,100 POC is on the cards in the coming days. But before that, it will face barriers at $2,800. This level is a confluence of its immediate resistance as well as the 50 EMA (Cyan). Thus, a possible test of its trendline support before reversing its figure should not surprise investors/traders.
Rationale
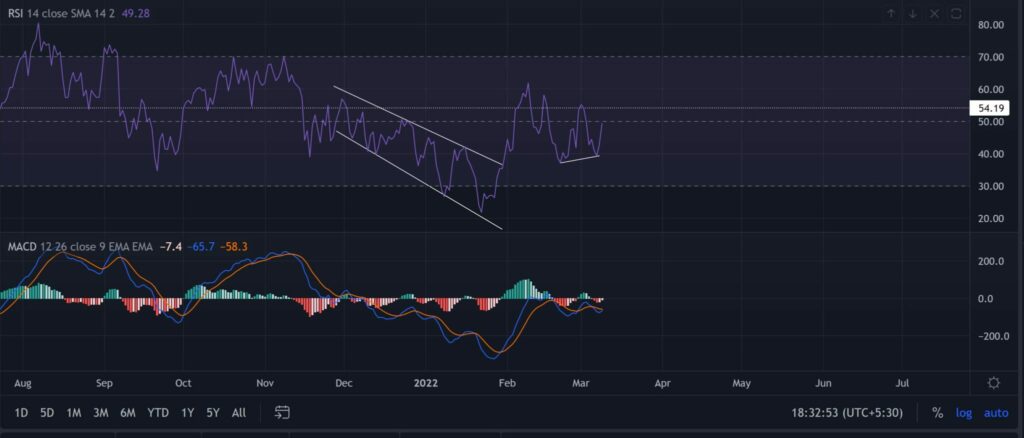
With the RSI marking higher lows, it bullishly diverged with the price and confirmed buying strength at its trendline support. Going forward, a close above the midline would heighten chances for a further recovery towards the 54-point resistance.
Additionally, the MACD lines were about to perform a bullish crossover. If they cross, they still have to cross the zero line to claim unbridled bullish momentum.
Conclusion
Considering the harmony between multiple factors, a near-term pullback from $2,800 seemed to be probable. Following this, if the bulls gather enough force on increased volumes, a patterned breakout might be lurking around the corner. Besides that, investors/traders need to closely watch out for Bitcoin’s movement as ETH shares a 94% 30-day correlation with it.