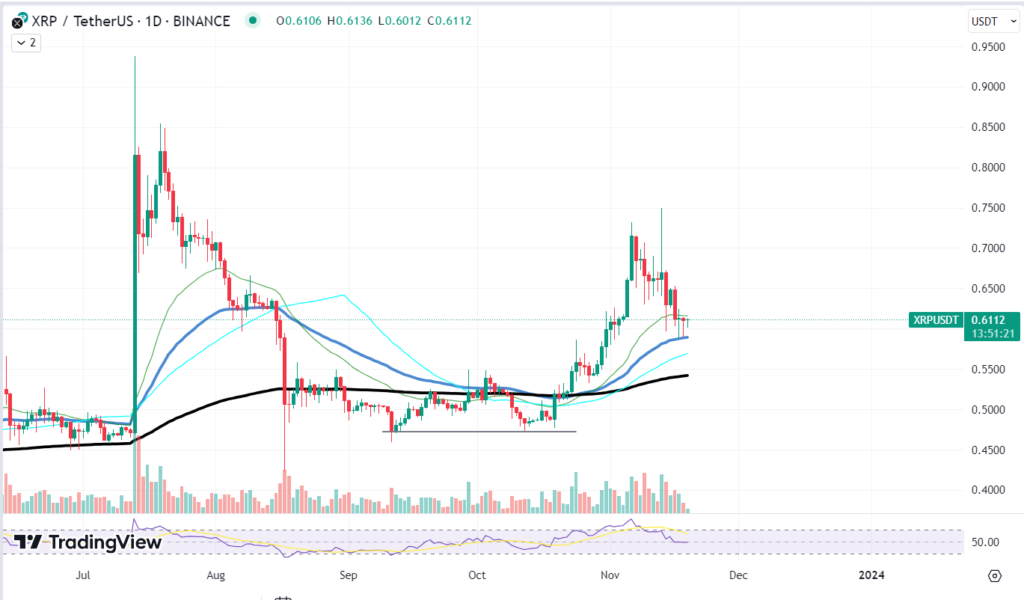
The daily XRP/USDT chart illustrates the durability and volatility of XRP’s price movements. The daily chart shows a strong support level at about $0.60, which is comparable to “adamantium” due to its resistance to several bearish attacks. A solid hold above this level might indicate the possibility of a comeback and the continuation of the rally. This support zone is crucial.
The $0.65 level stands out as a critical hurdle on the resistance frontier that bulls must cross in order to maintain their upward momentum. A break above this mark may open the door for a retesting of earlier highs at $0.75, where a number of sell orders may be waiting.

Regarding rally continuations, there are primarily two factors to take into account. Positive developments in Ripple’s current litigation or adoption news might sustain XRP’s hold above the adamantium support, which could lead to a spike as investors restore confidence. On the other hand, if bearish forces prevail, a break below $0.60 may start a sell-off and force prices to look for lower support, possibly in the $0.55–$0.65 range, where the 50-day moving average is waiting.
With Ripple continuously forming alliances and refining its payment protocols, the XRP ecosystem is still expanding and might potentially act as a catalyst for price changes. When the market processes these developments, it will be important to keep an eye on the strong support level for clues about XRP’s next major move.


